
Signature Luxury Report

Signature Full Year 2025 Luxury Report cover featuring a glass staircase overlooking the city.

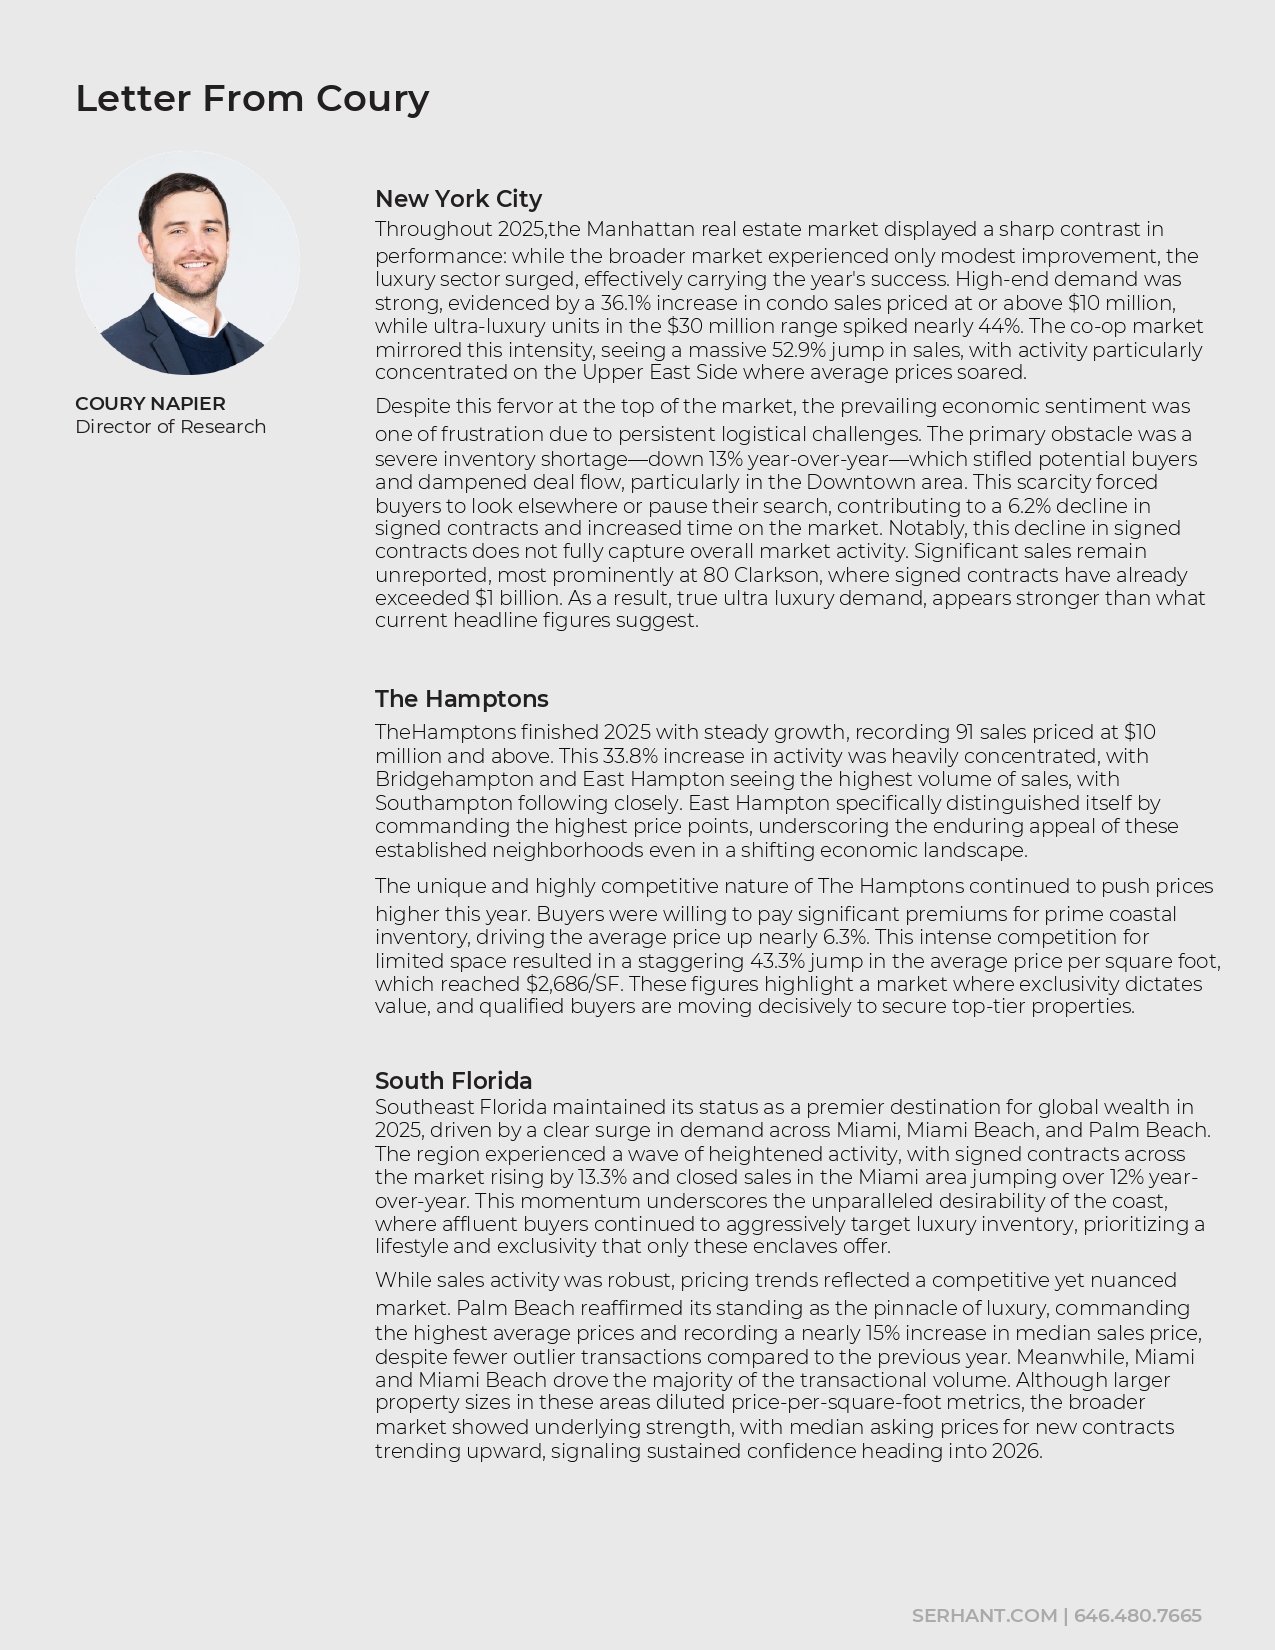
2025 luxury real estate market update for New York City, the Hamptons, and South Florida, with Coury Napier’s portrait.

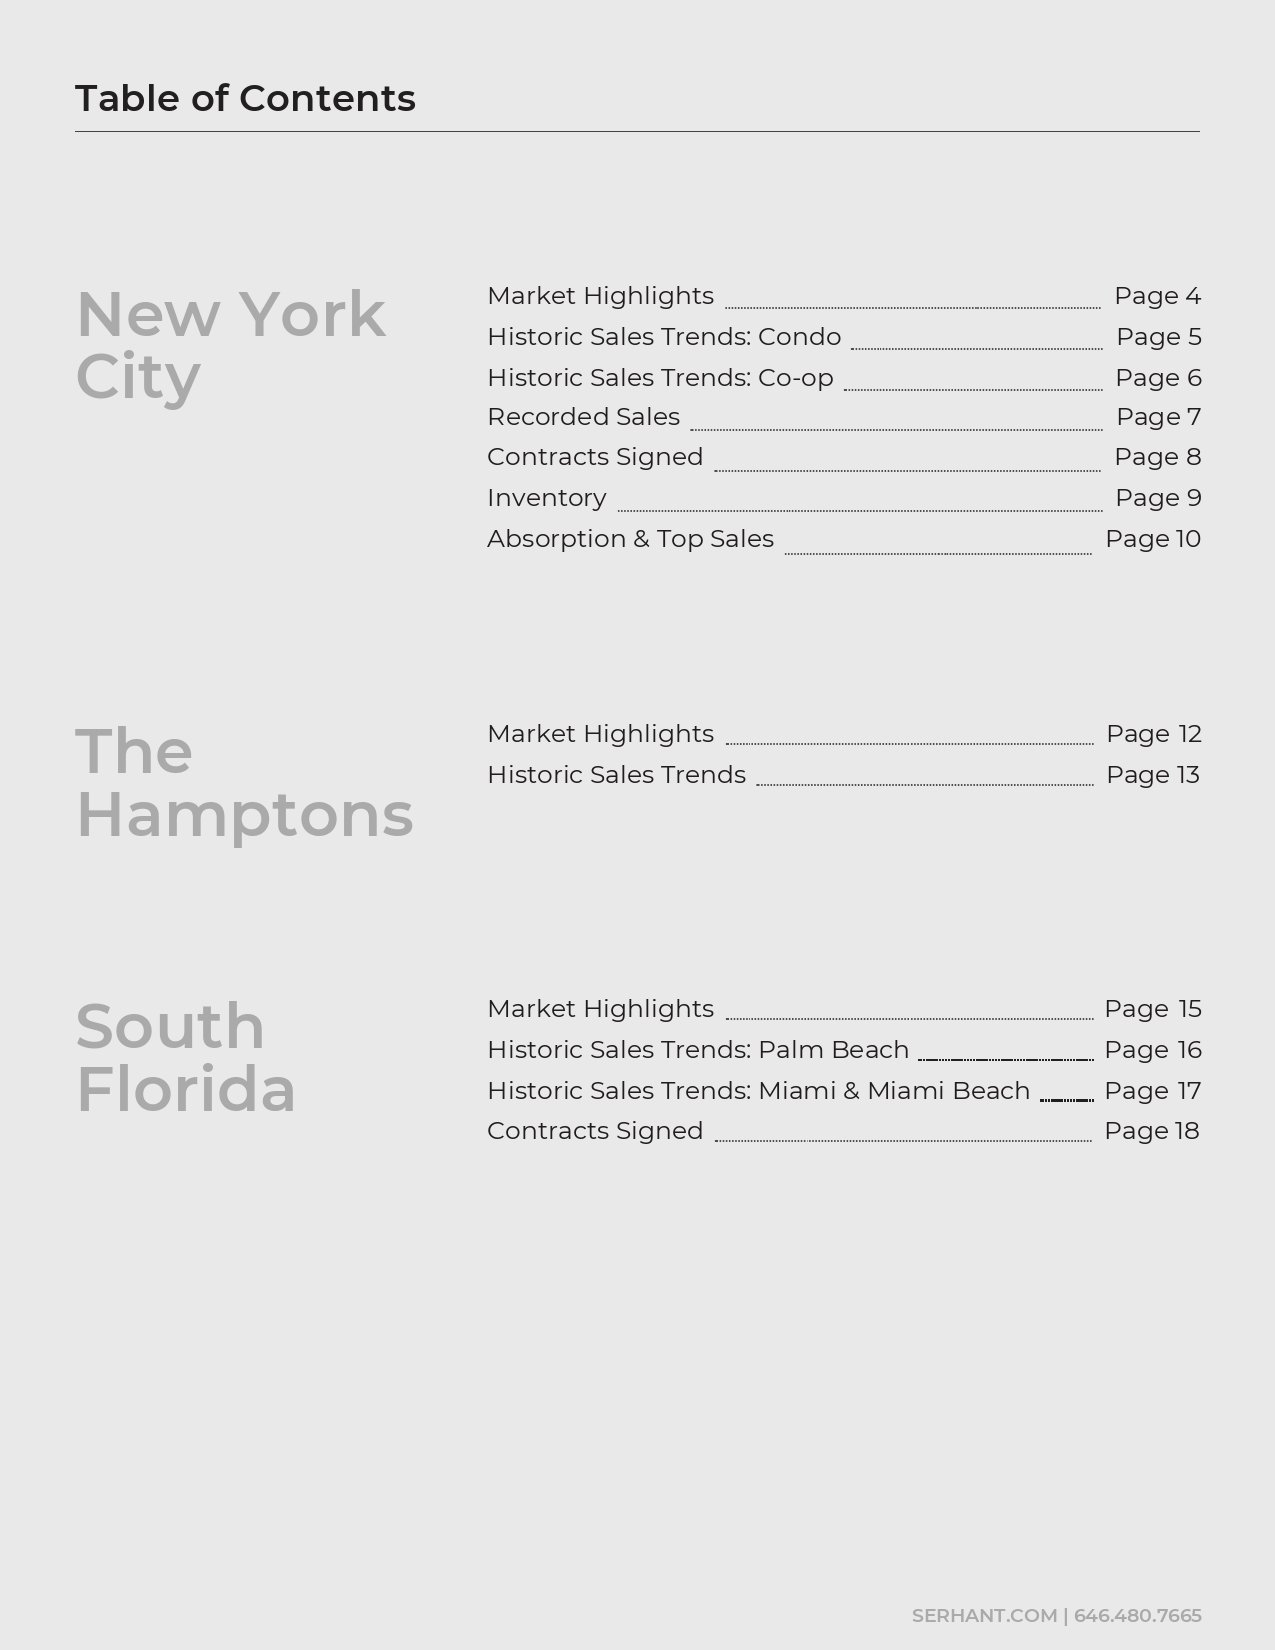
Table of contents for real estate market updates covering New York City, the Hamptons, and South Florida.

New York City skyline rises behind park trees, with “New York City” text.

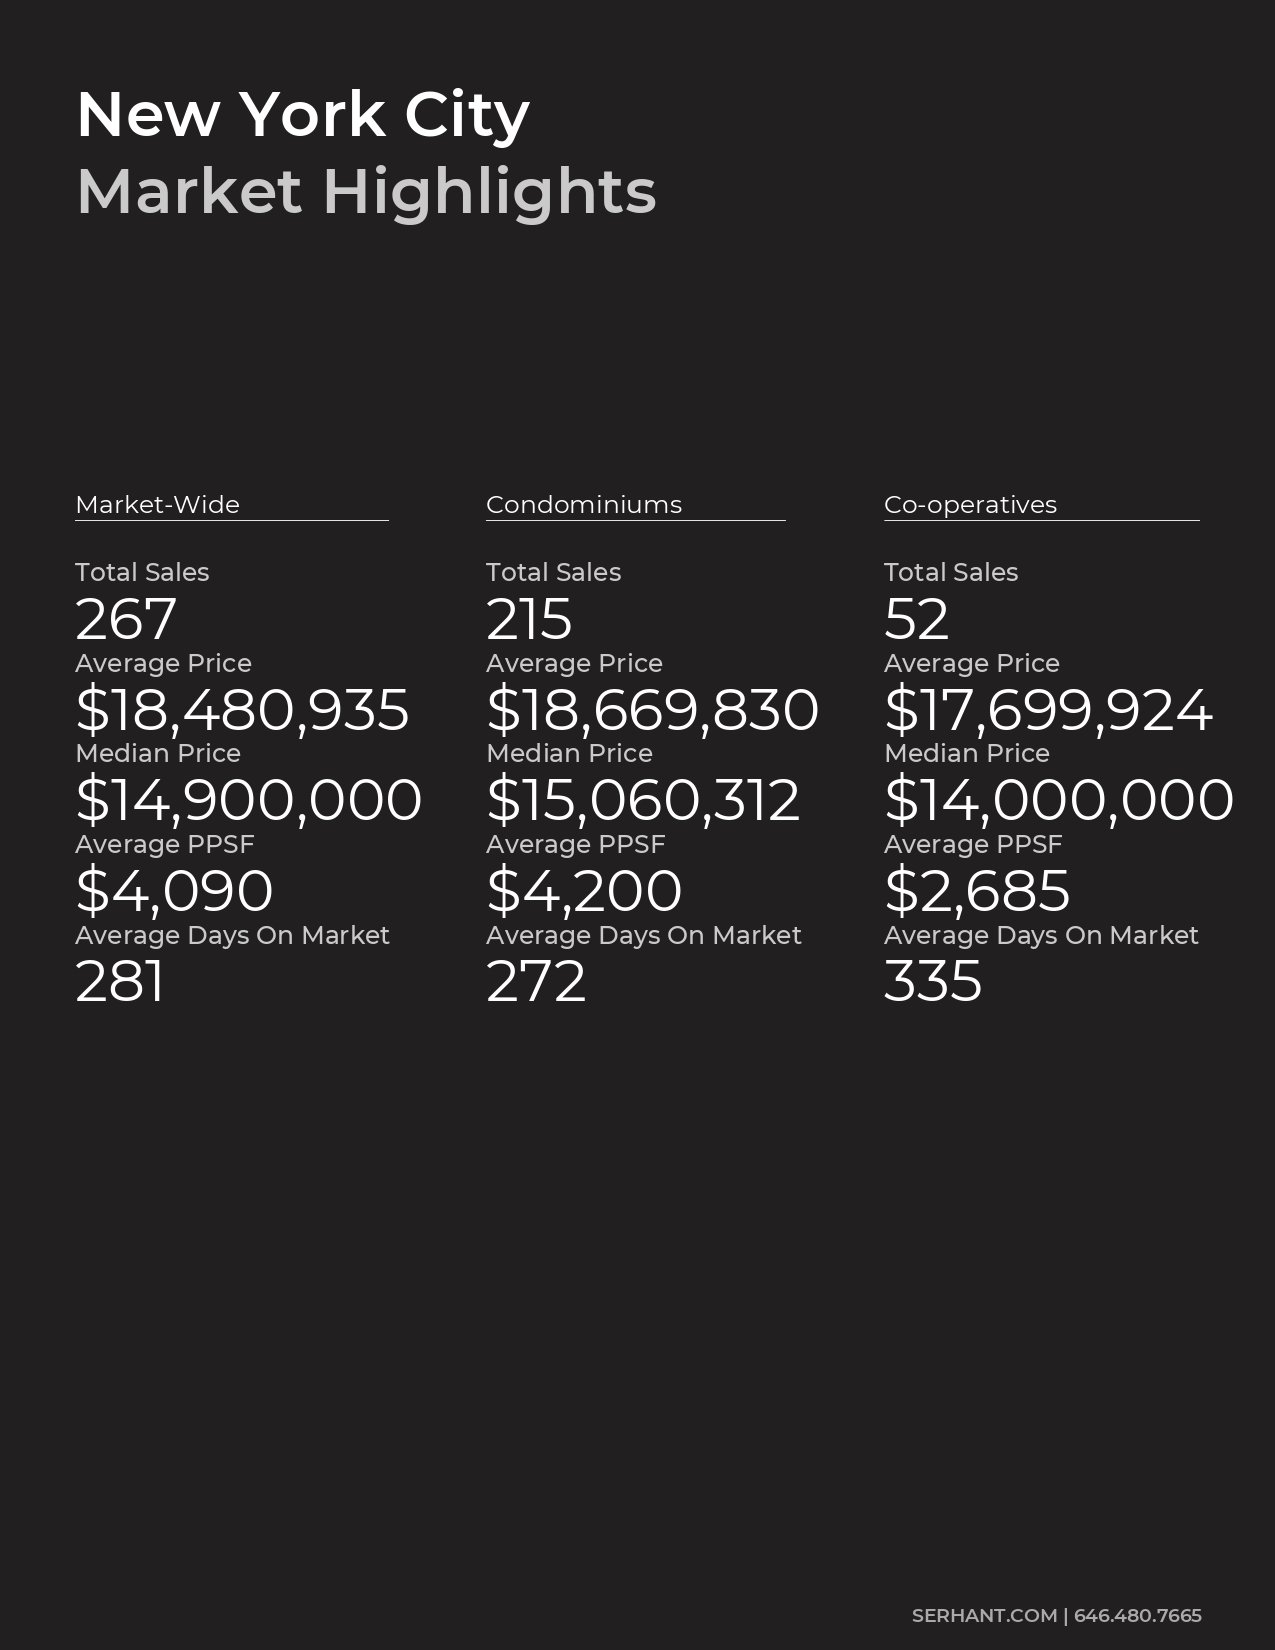
New York City market highlights compare sales, prices, price per square foot, and days on market across three categories.

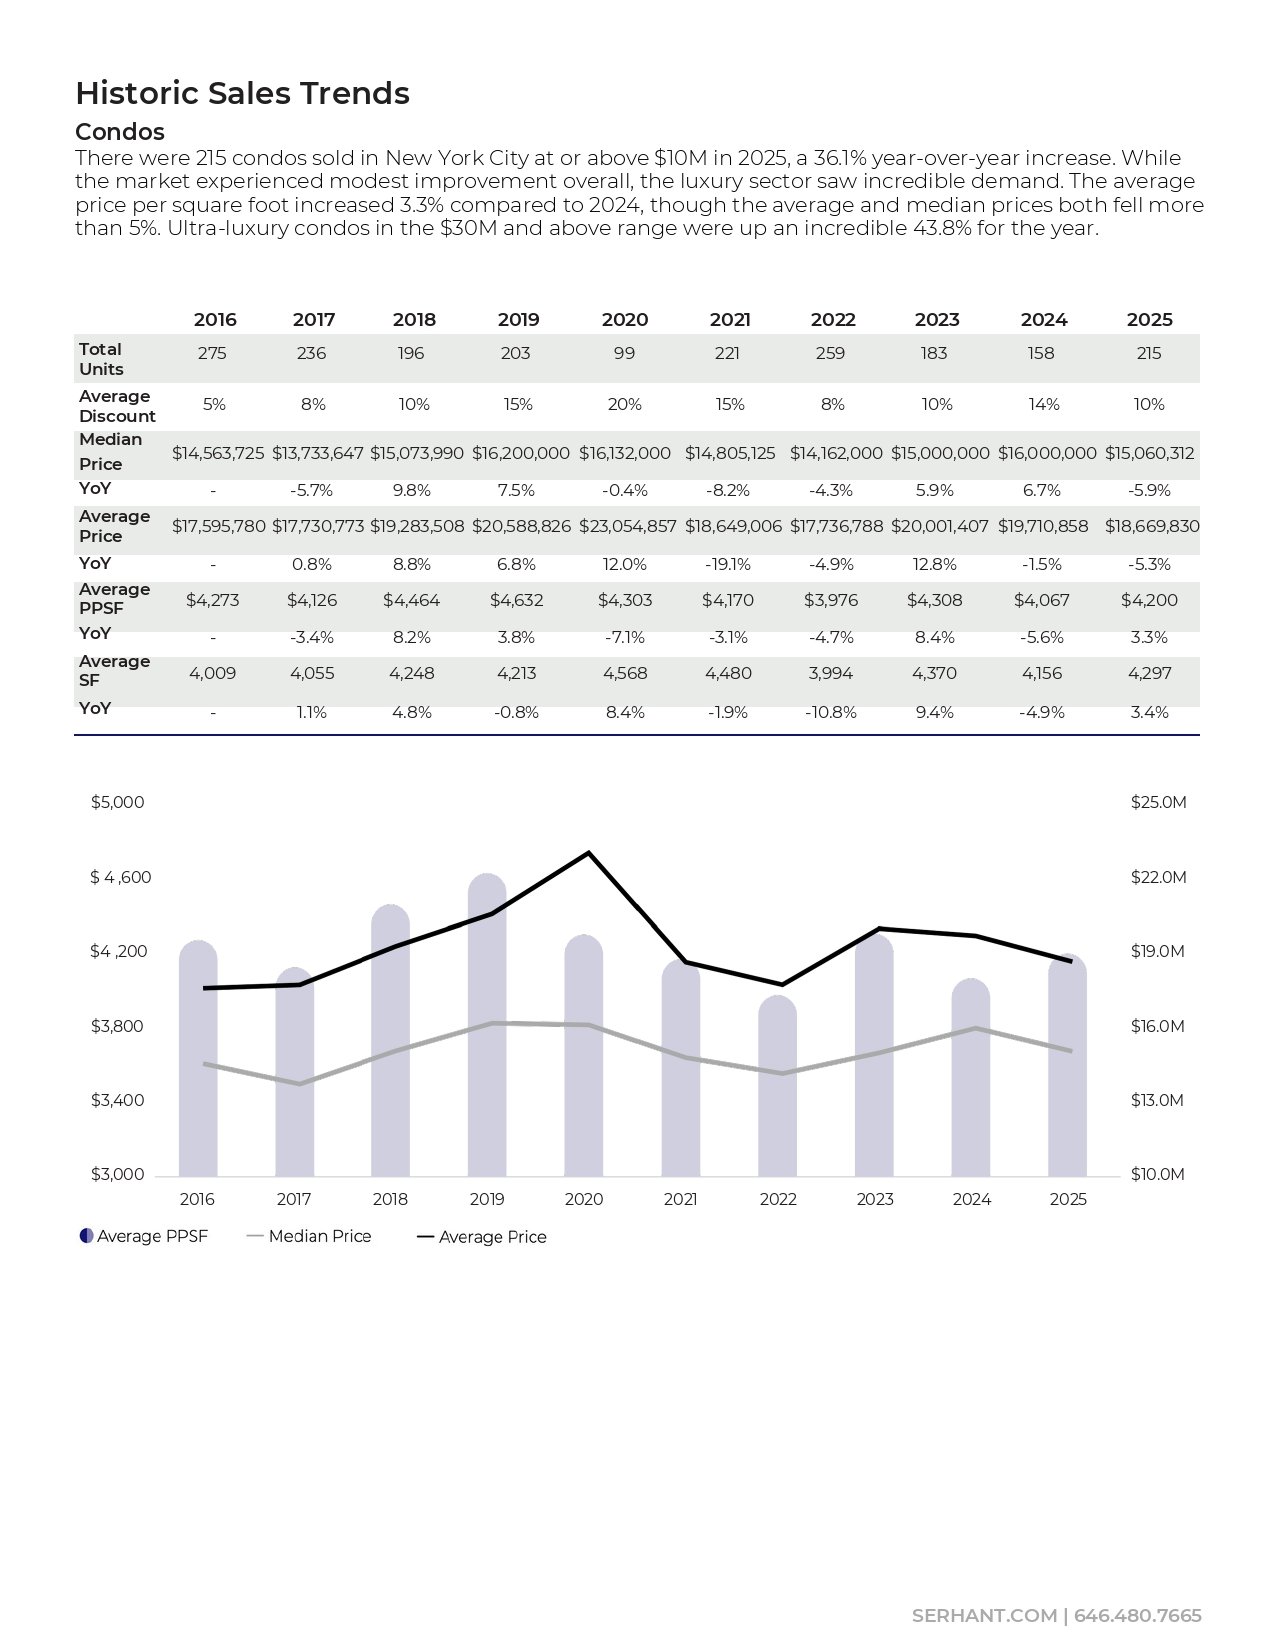
New York City condo sales trends, 2016–2025, with a data table and chart of prices and price per square foot.

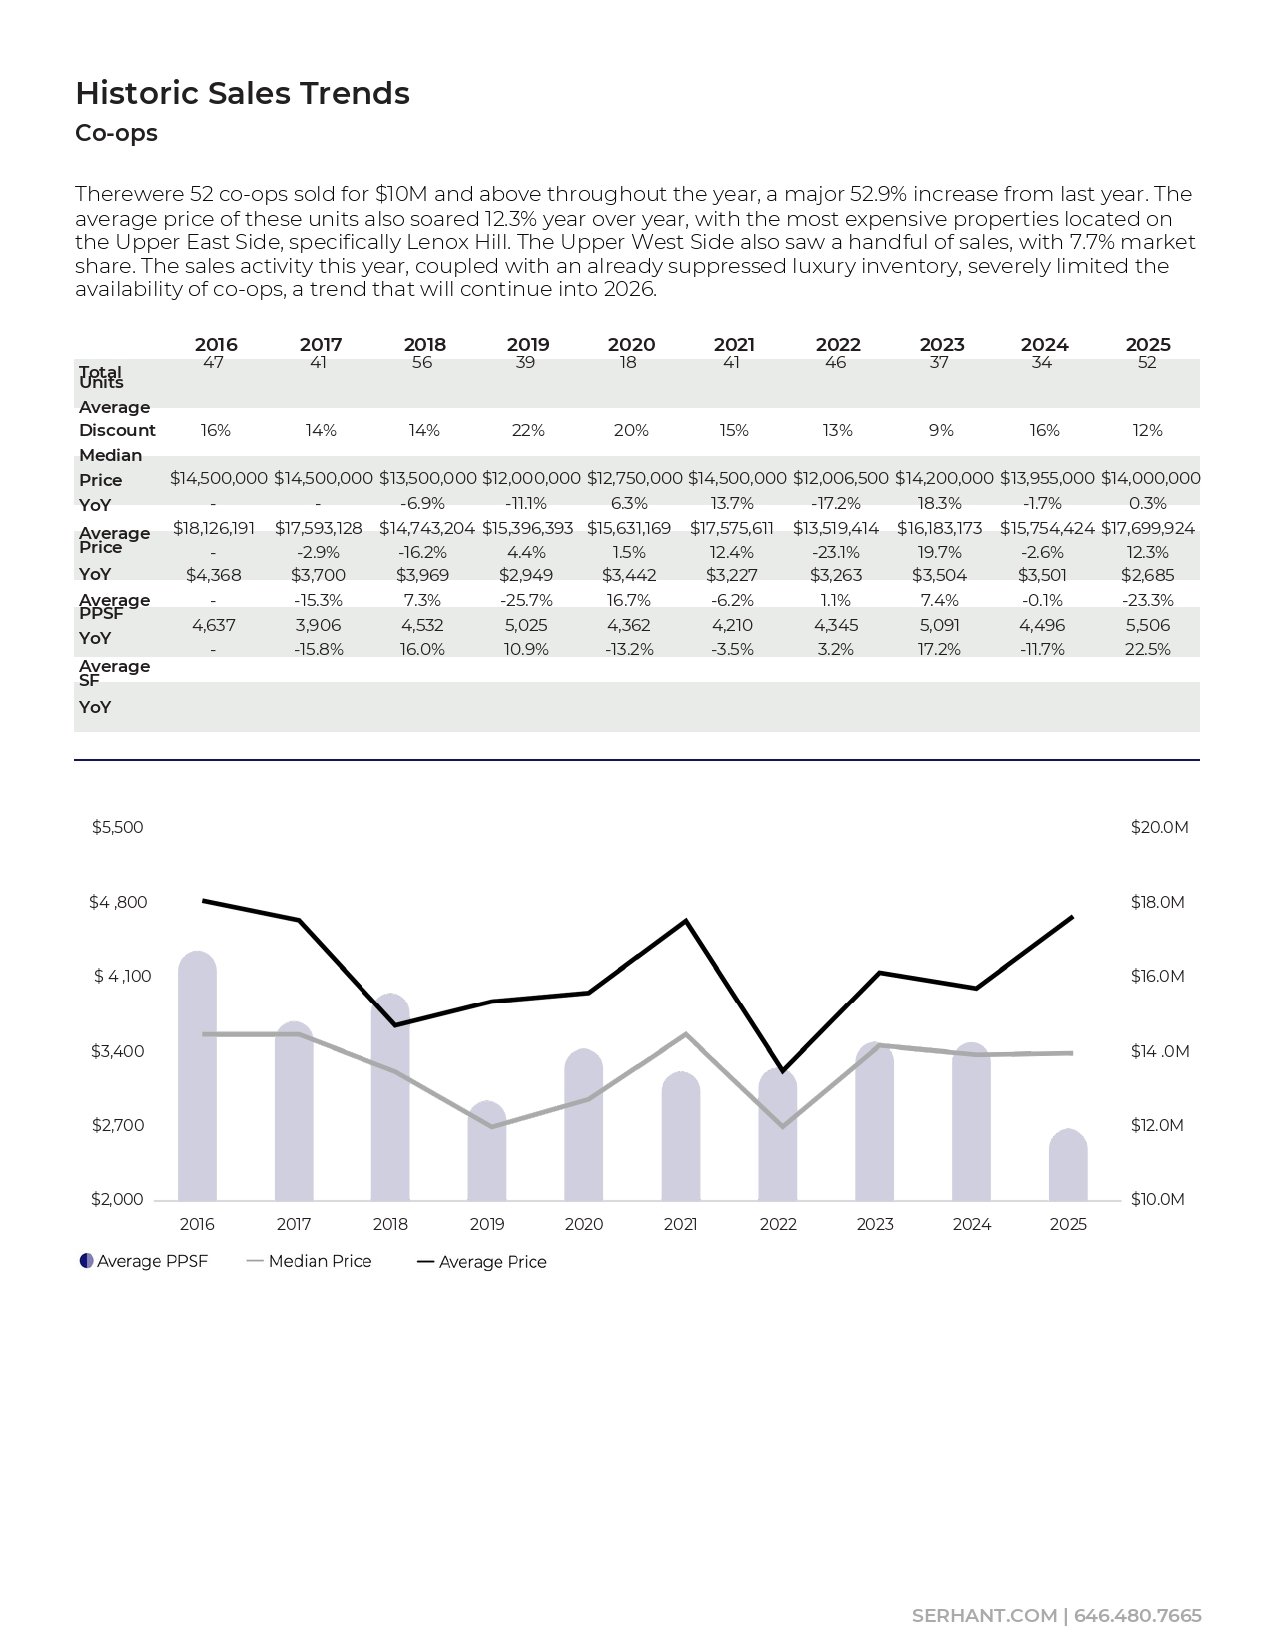
Historic co-op sales trends from 2016 to 2025, shown in a data table and price chart.

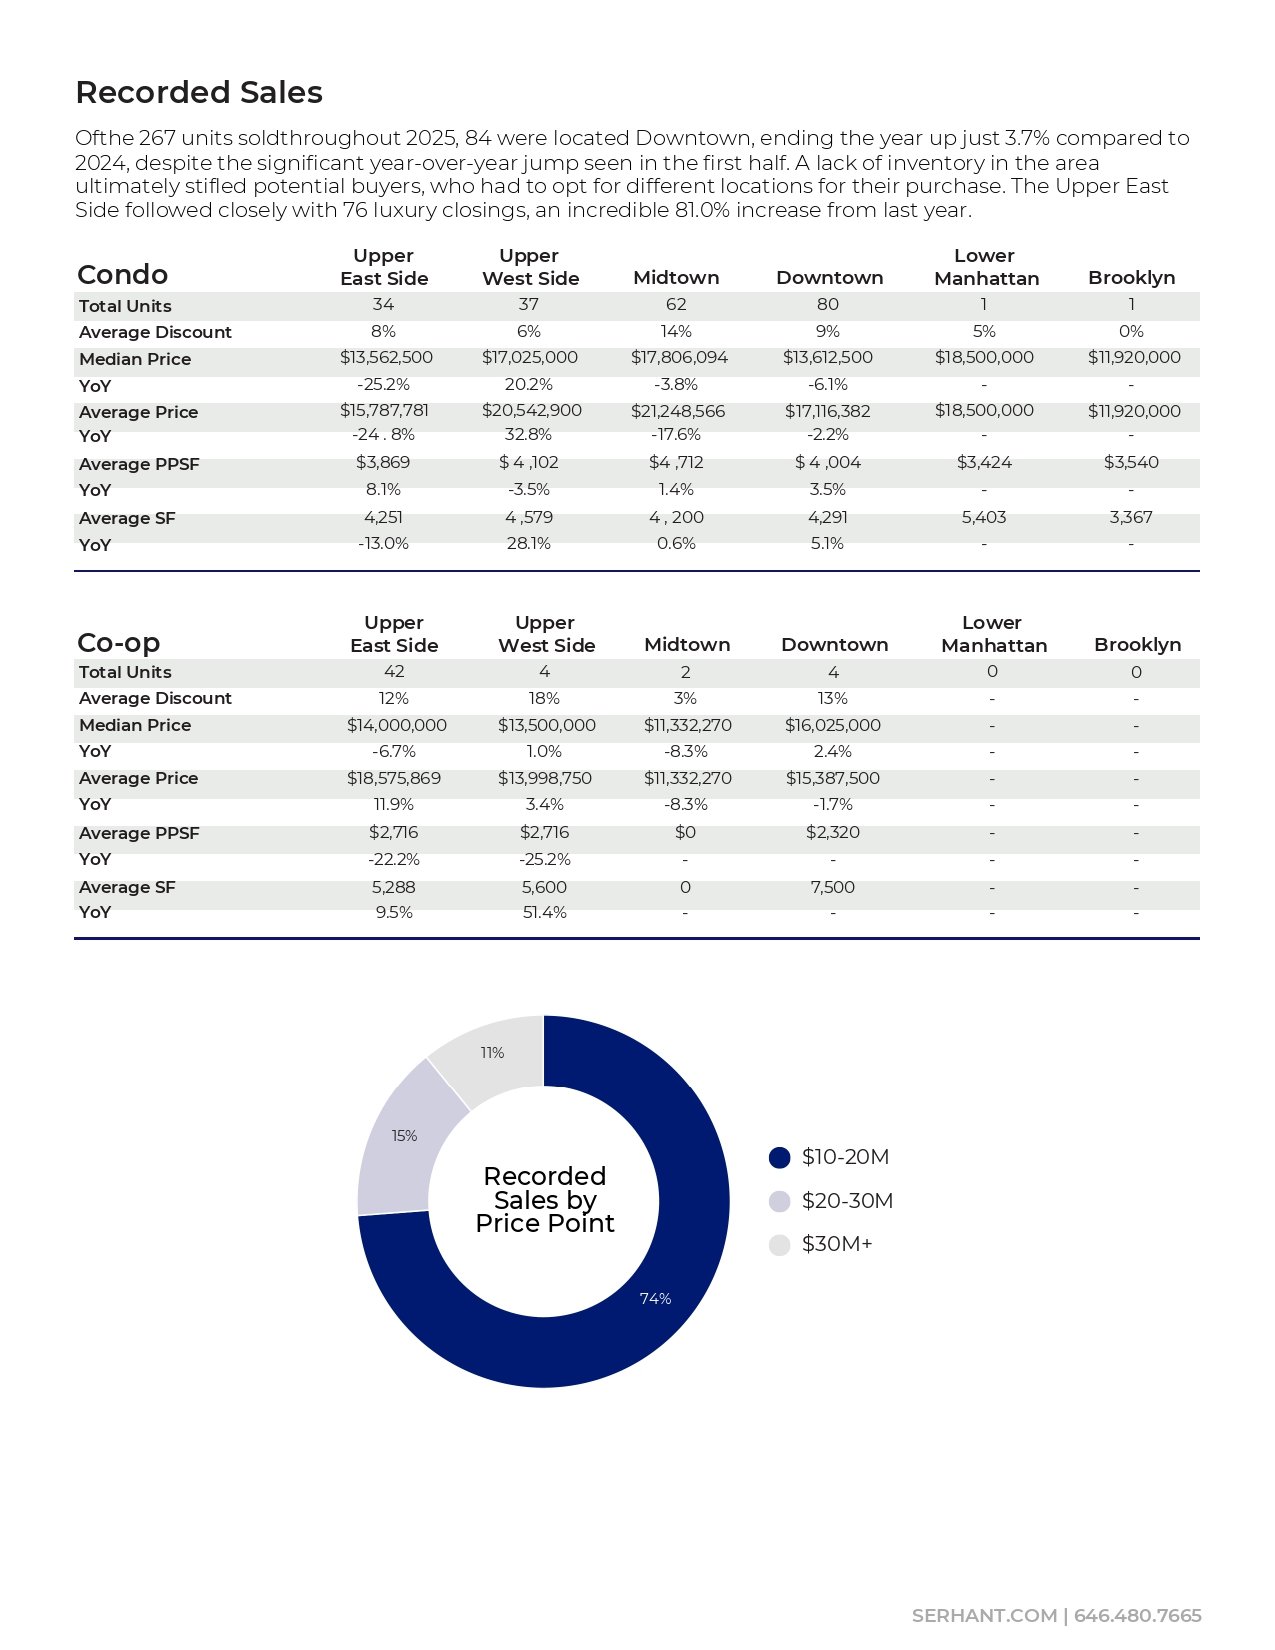
2025 condo and co-op sales statistics by neighborhood, with a donut chart of recorded sales by price point.

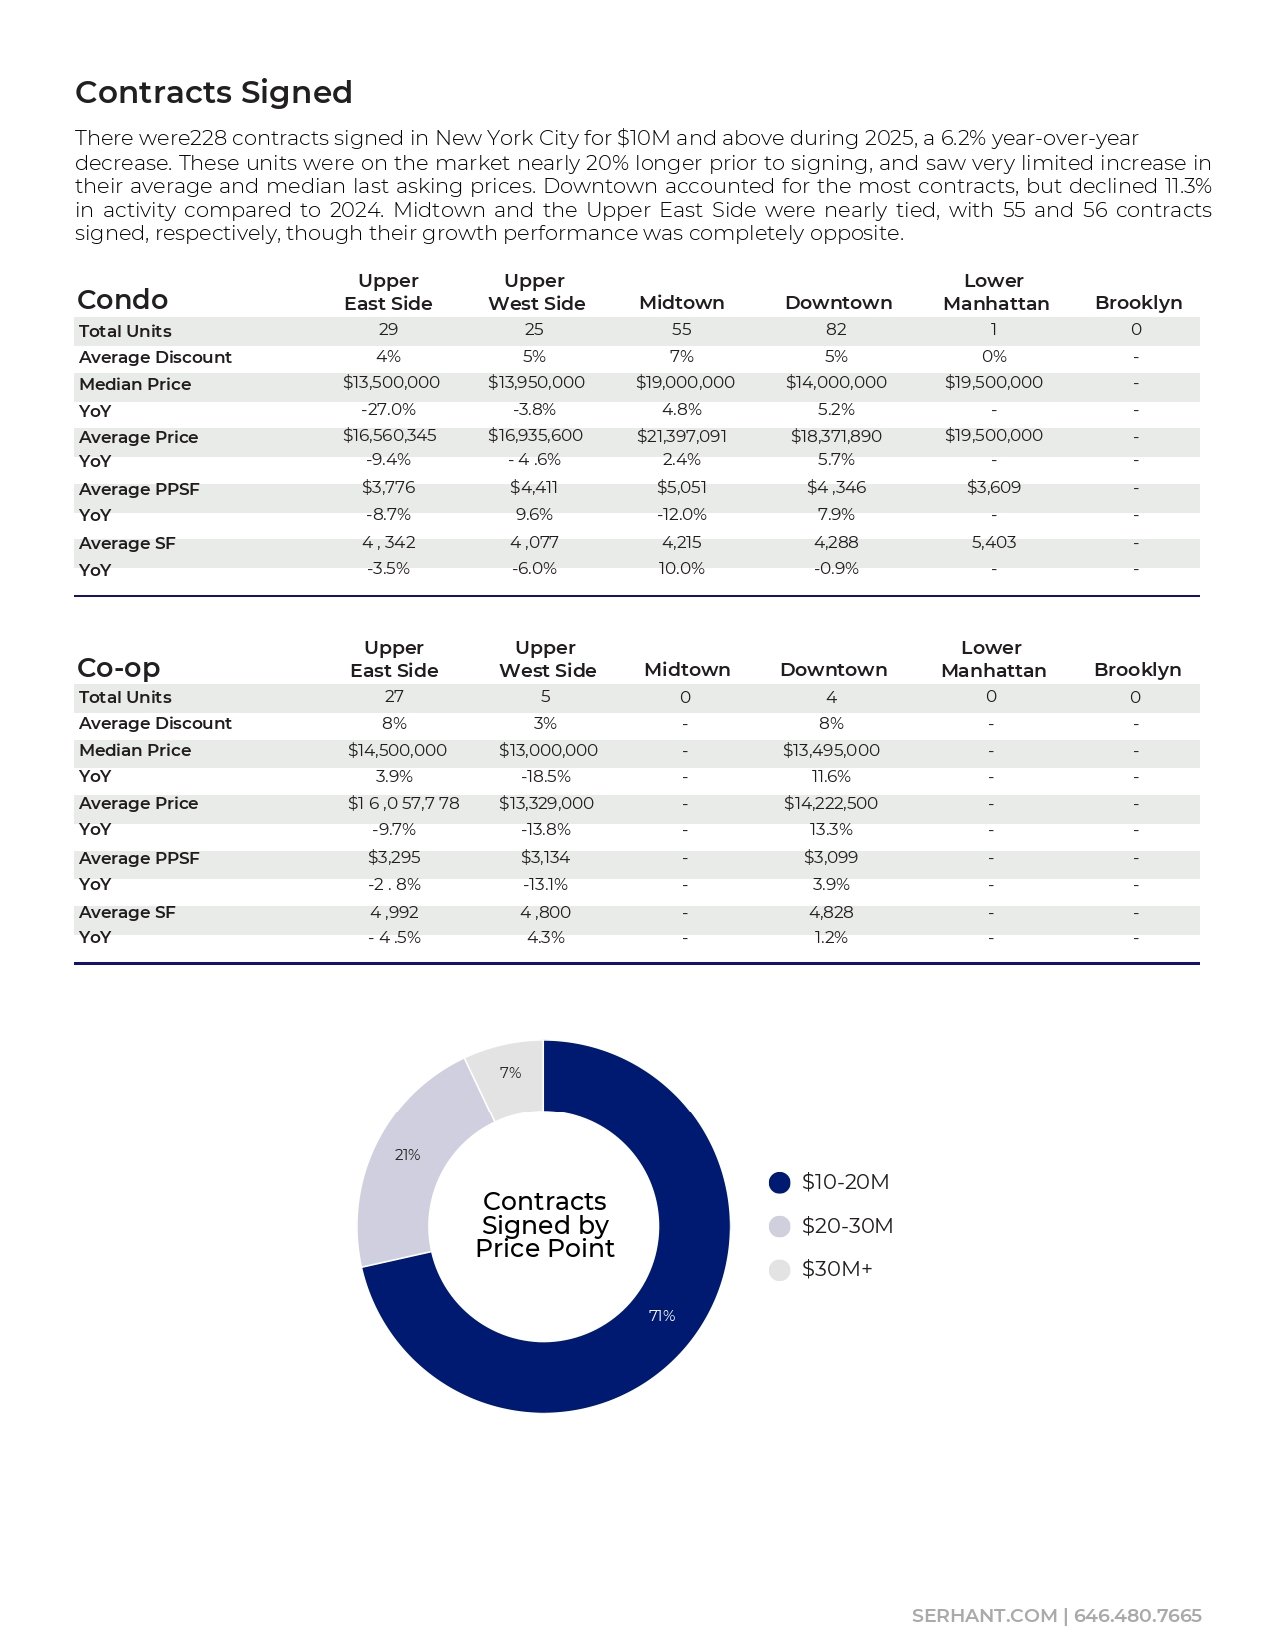
2025 NYC luxury contract infographic with neighborhood tables and a price-point donut chart.

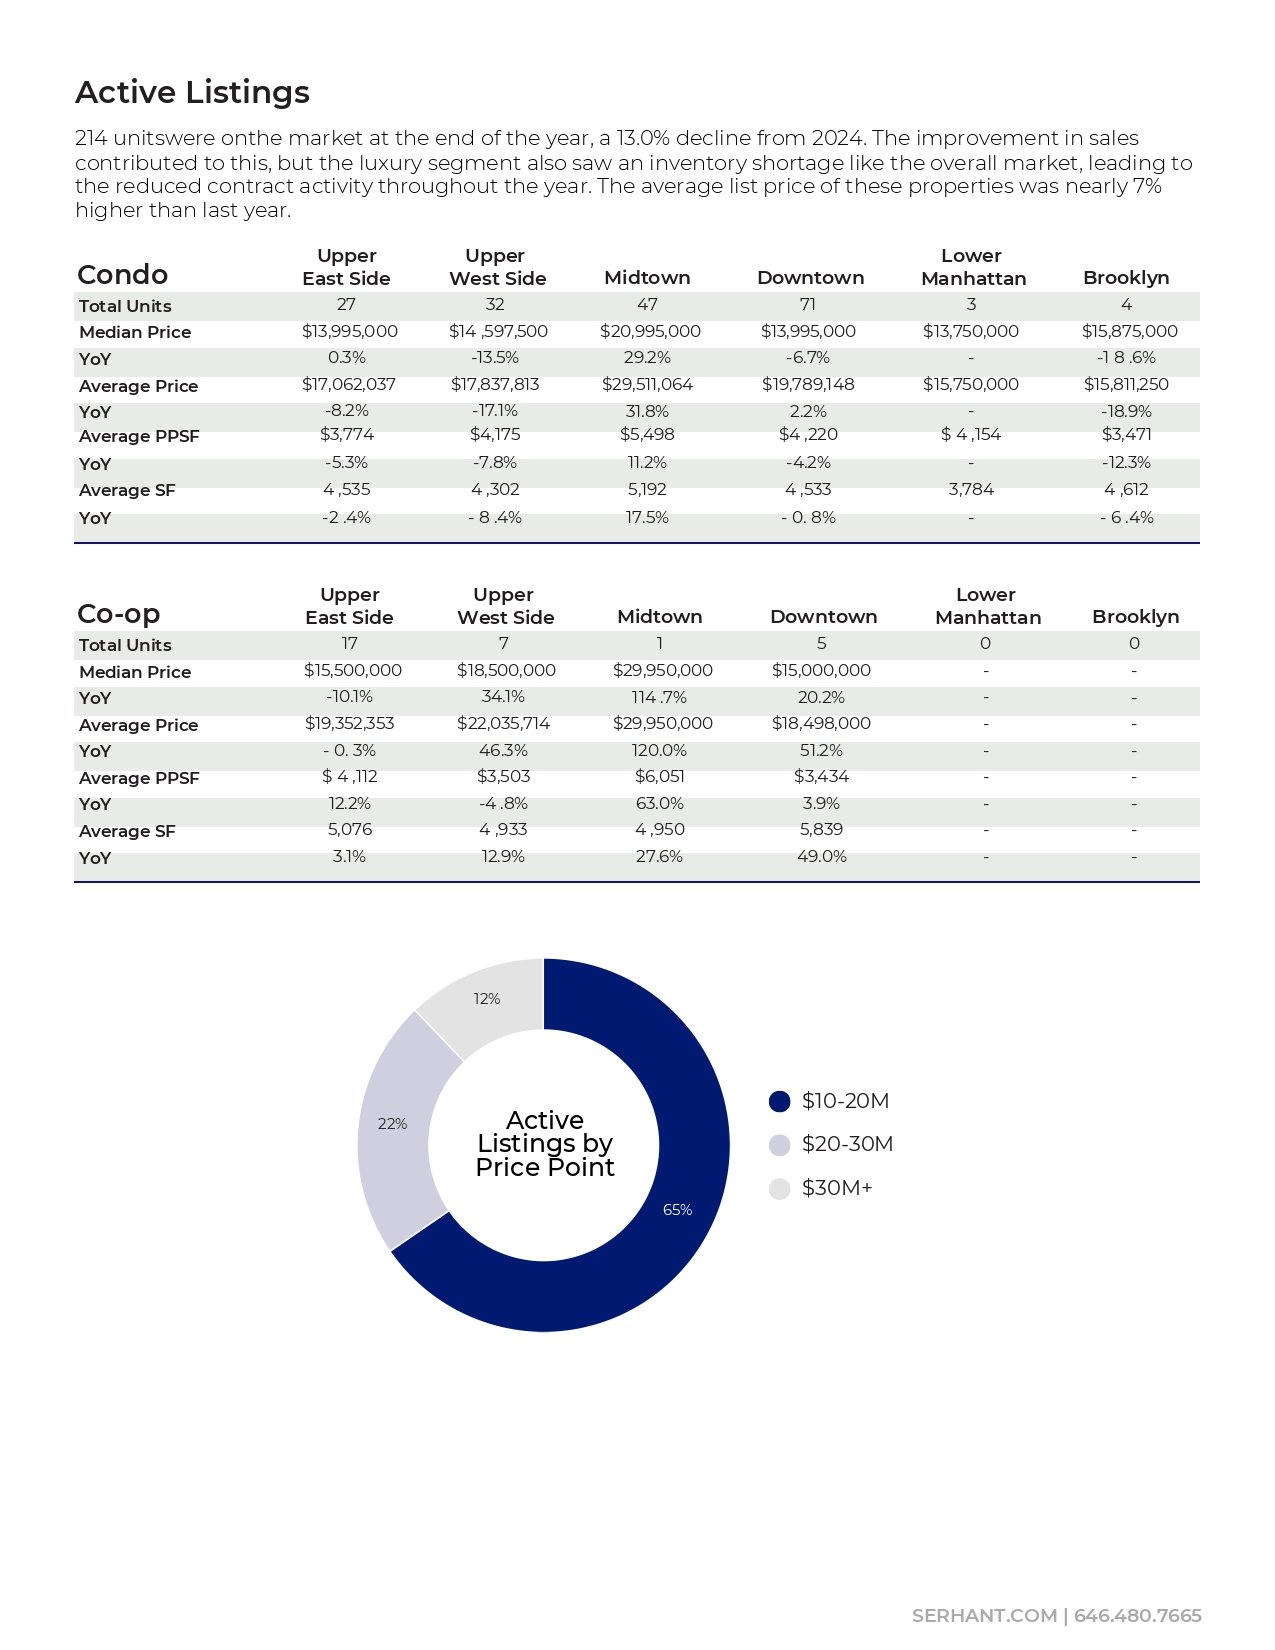
Active listings infographic with Manhattan and Brooklyn condo and co-op tables and a price-point donut chart.

Hamptons beach with a winding wooden dune fence, beach grass, and houses along the shore.

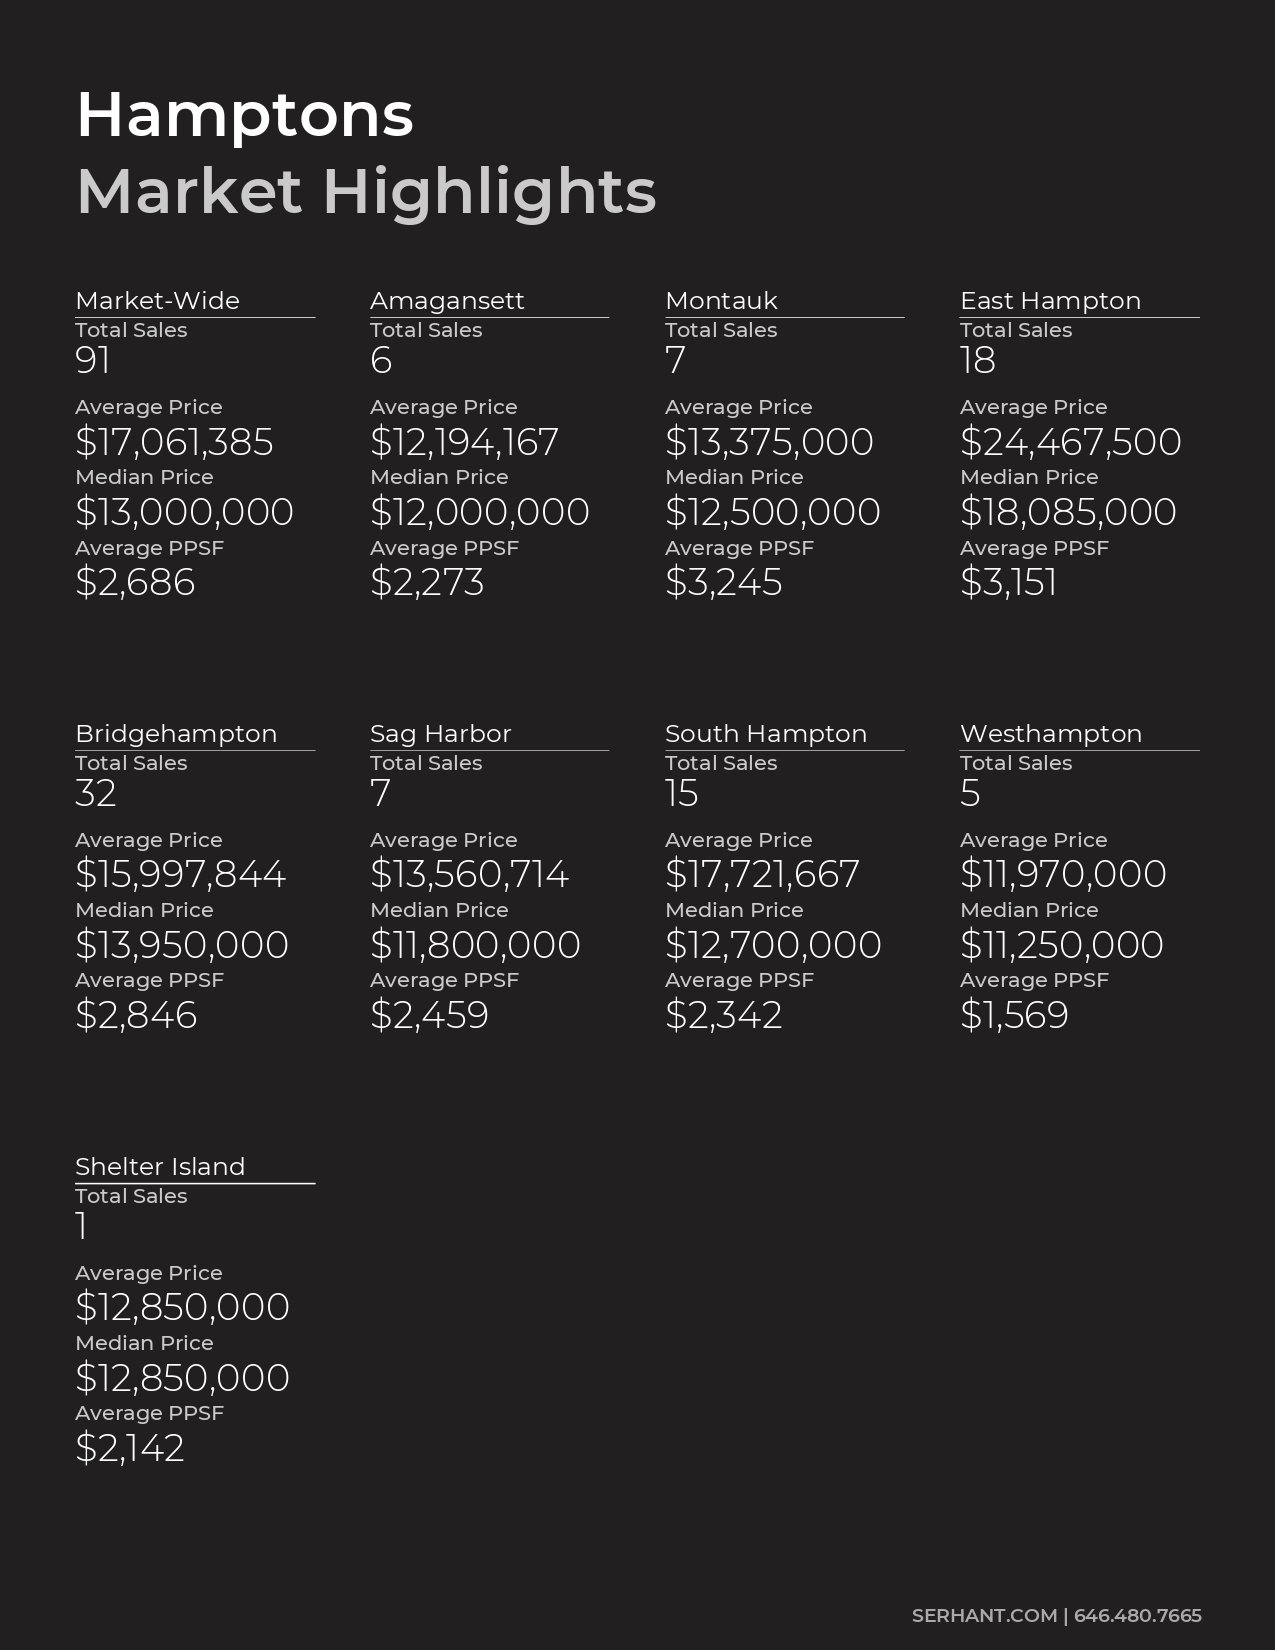
Hamptons market infographic comparing sales, average and median prices, and average price per square foot by area.

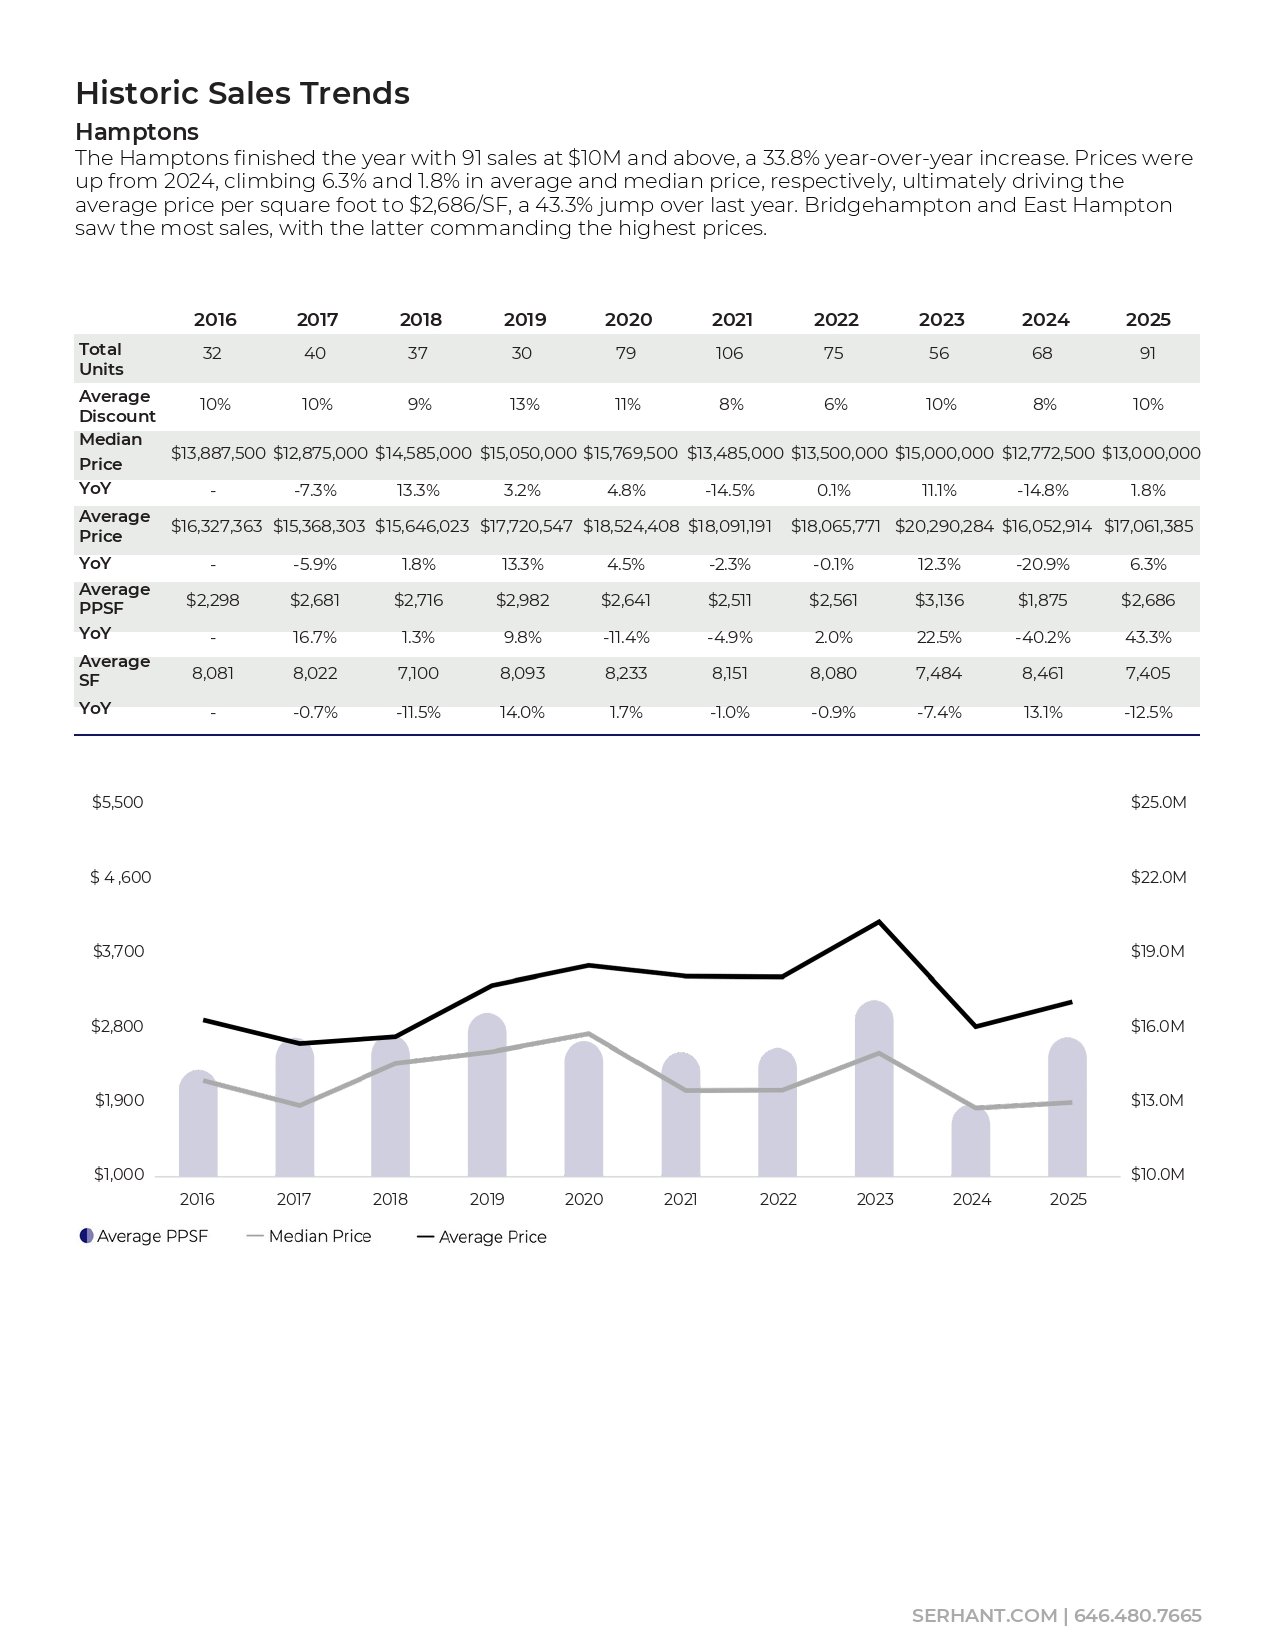
Hamptons historic sales trends table and chart for 2016–2025, with 2025 sales and price increases highlighted.

South Florida

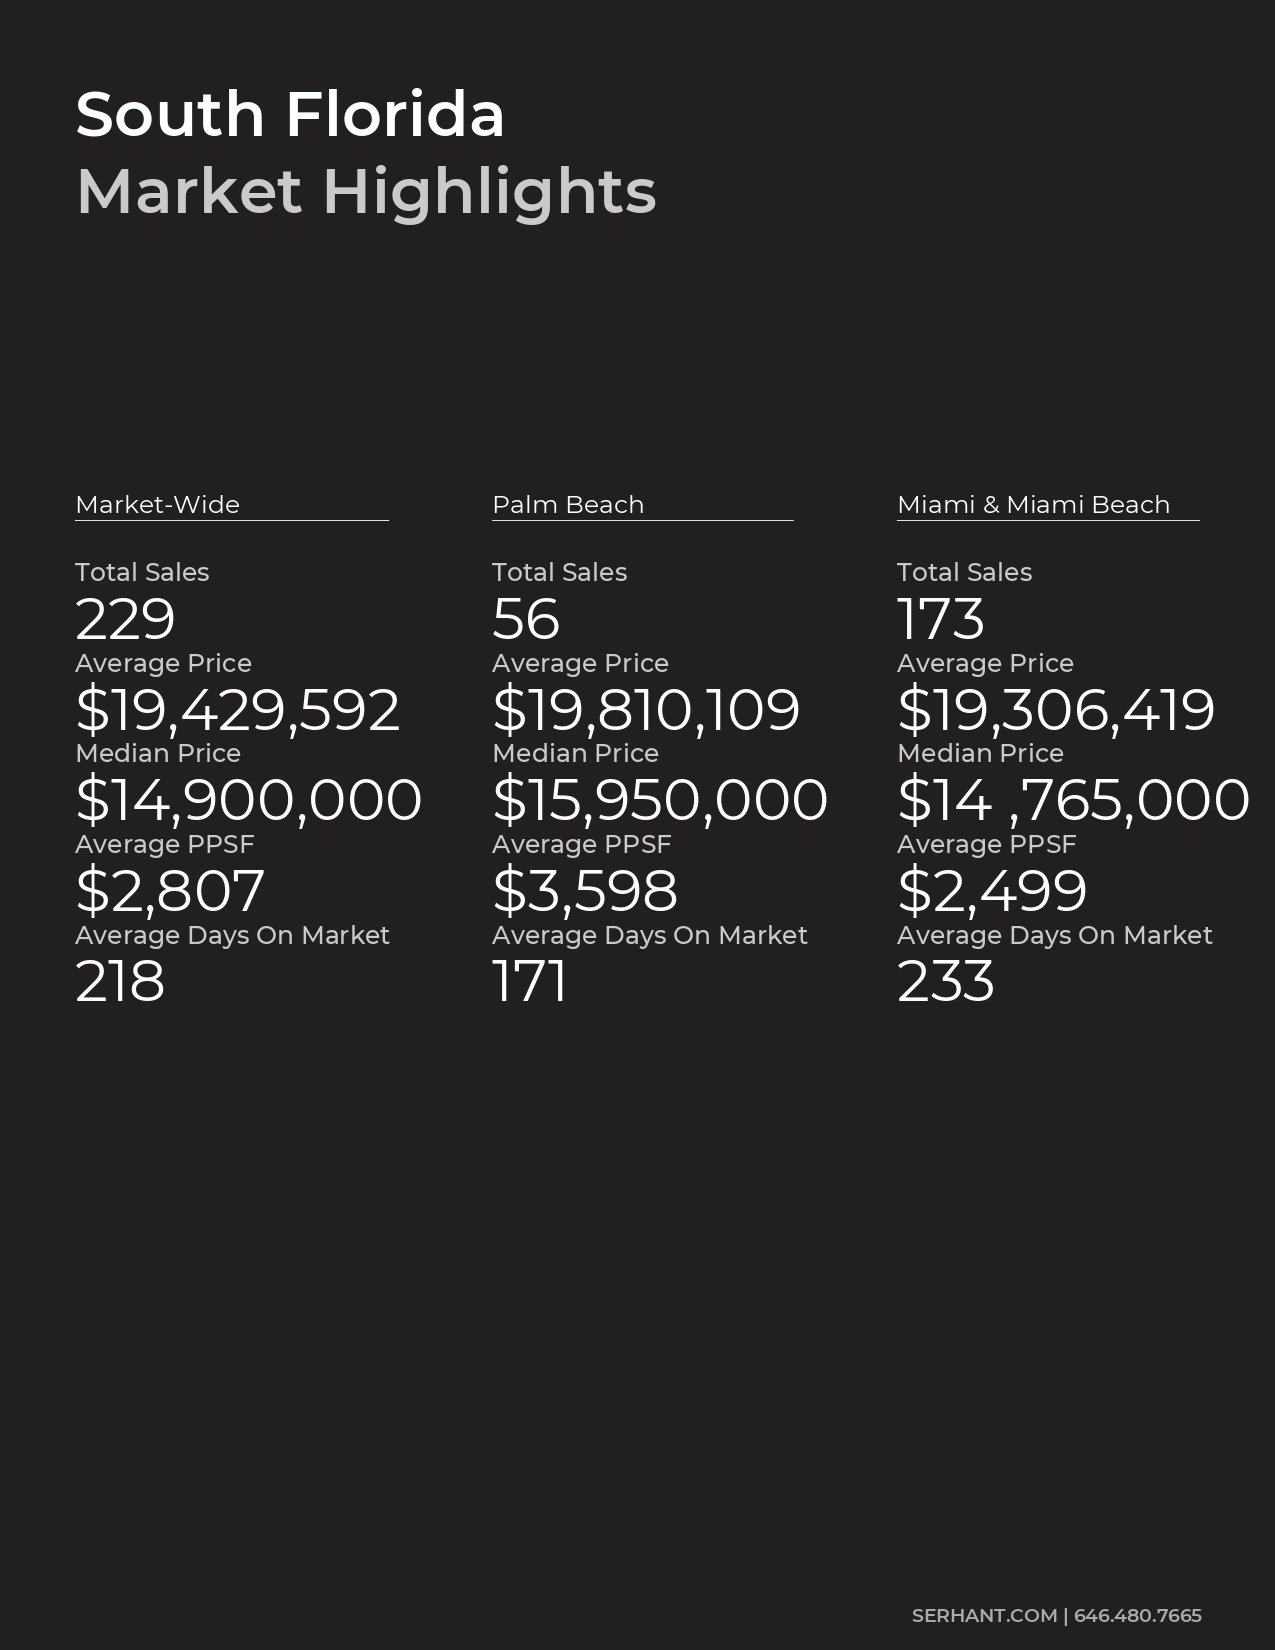
South Florida market highlights comparing sales, prices, and days on market across three areas.

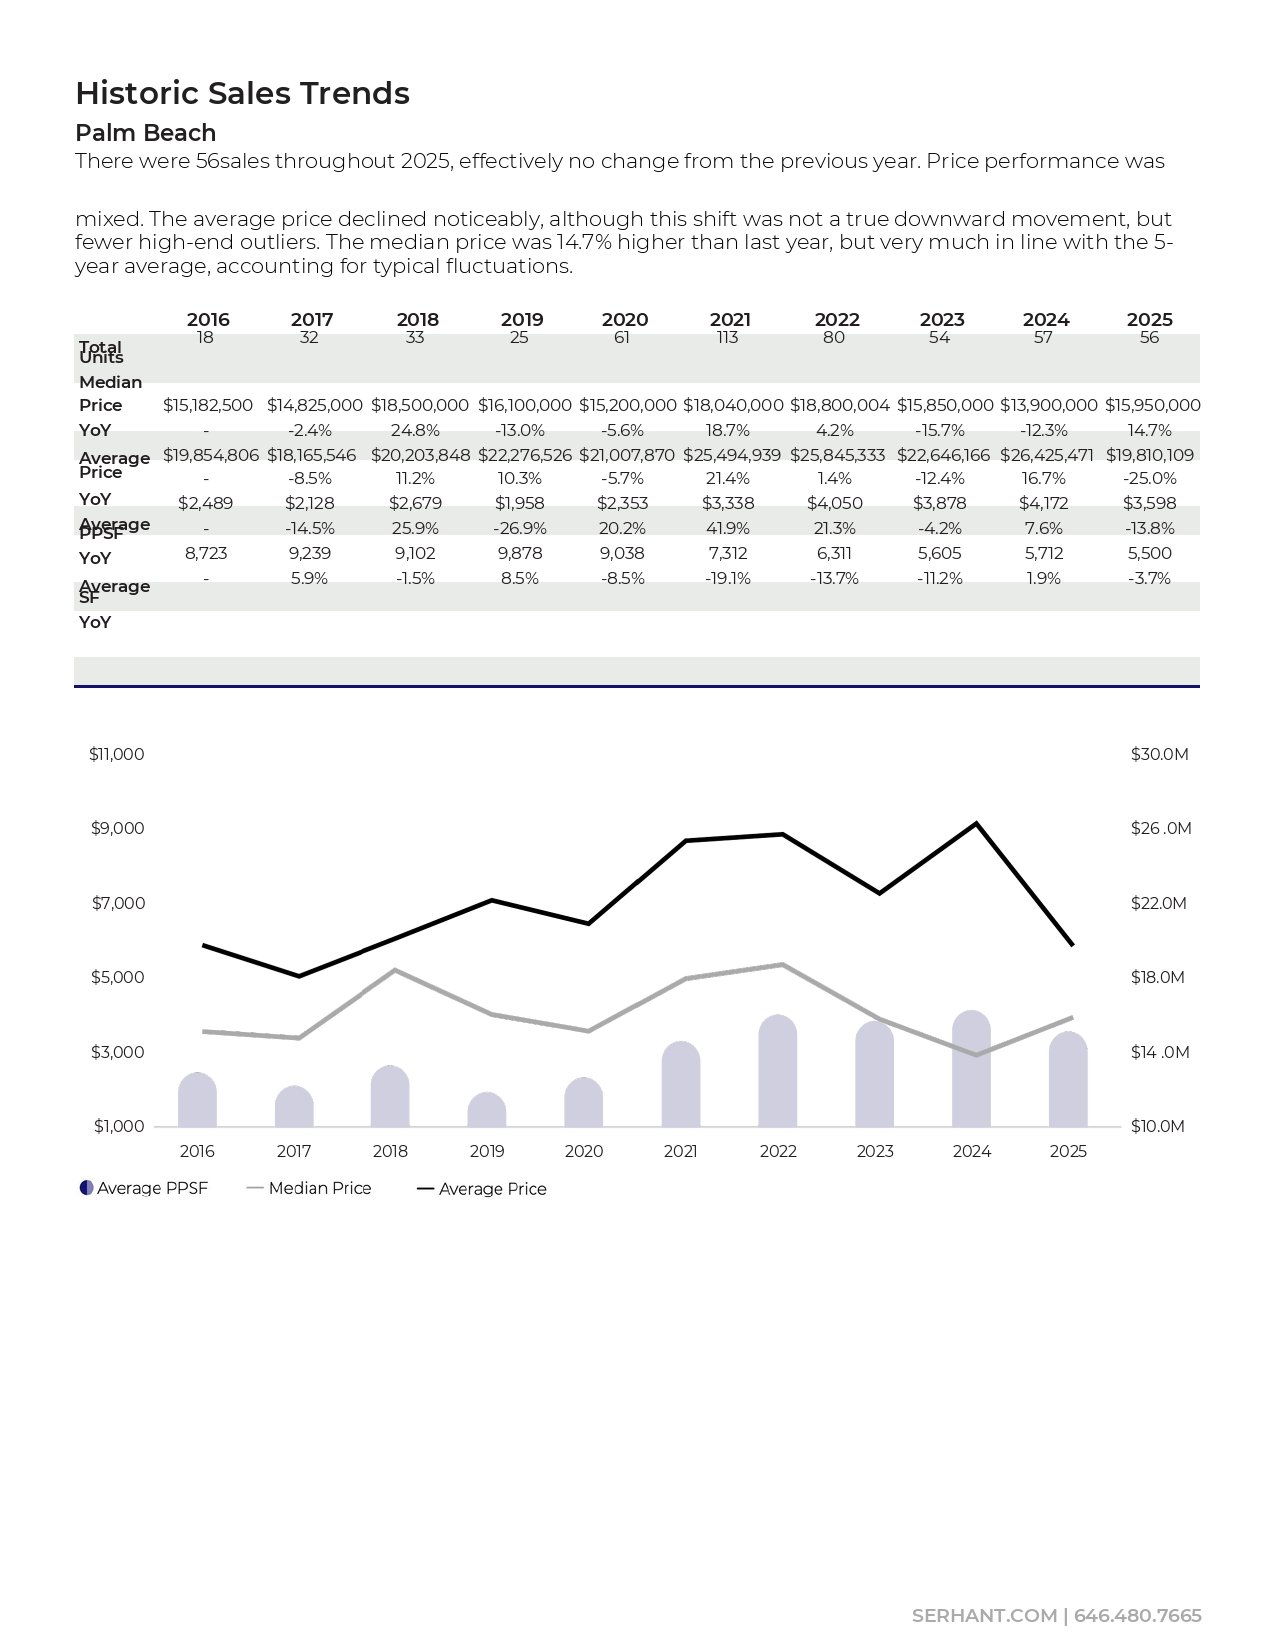
Palm Beach sales trends chart for 2016–2025, showing prices, average price per square foot, and annual sales data.

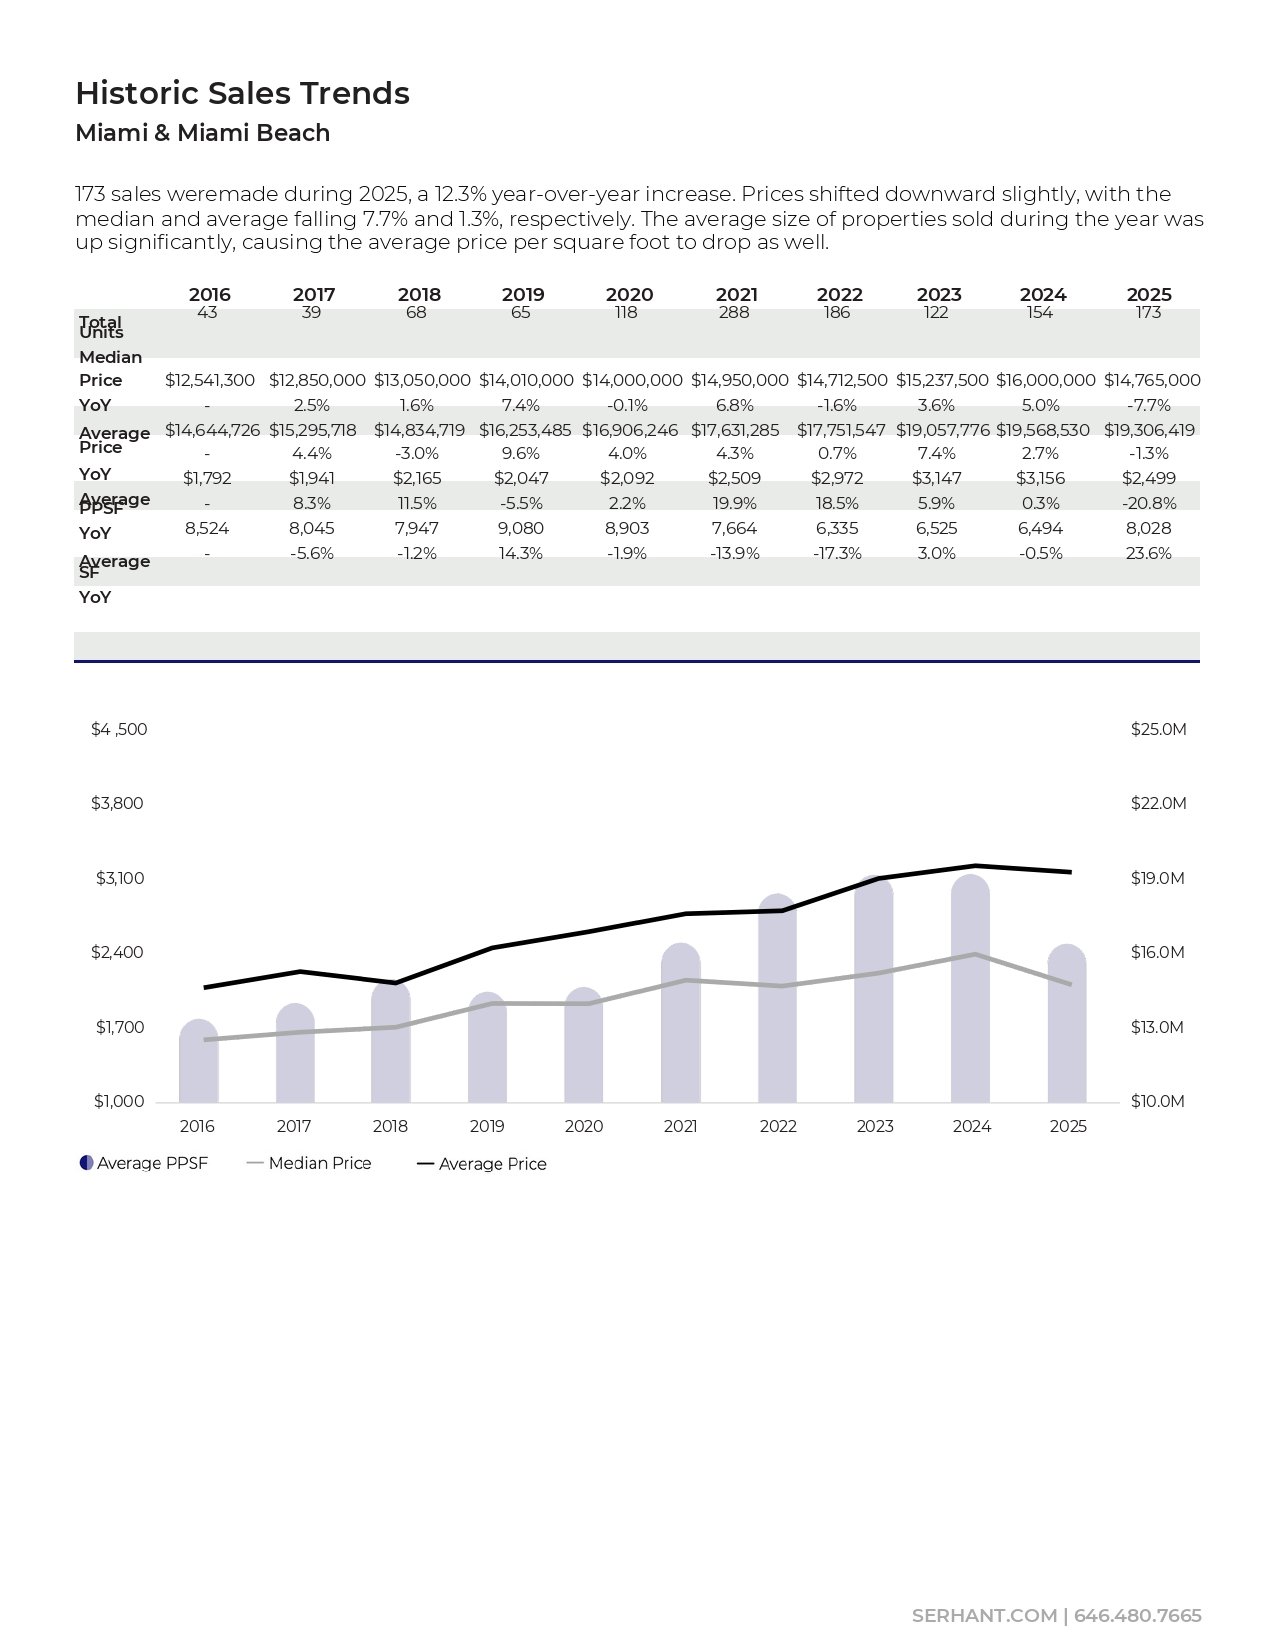
Miami and Miami Beach sales trends, 2016–2025, in a table and chart.

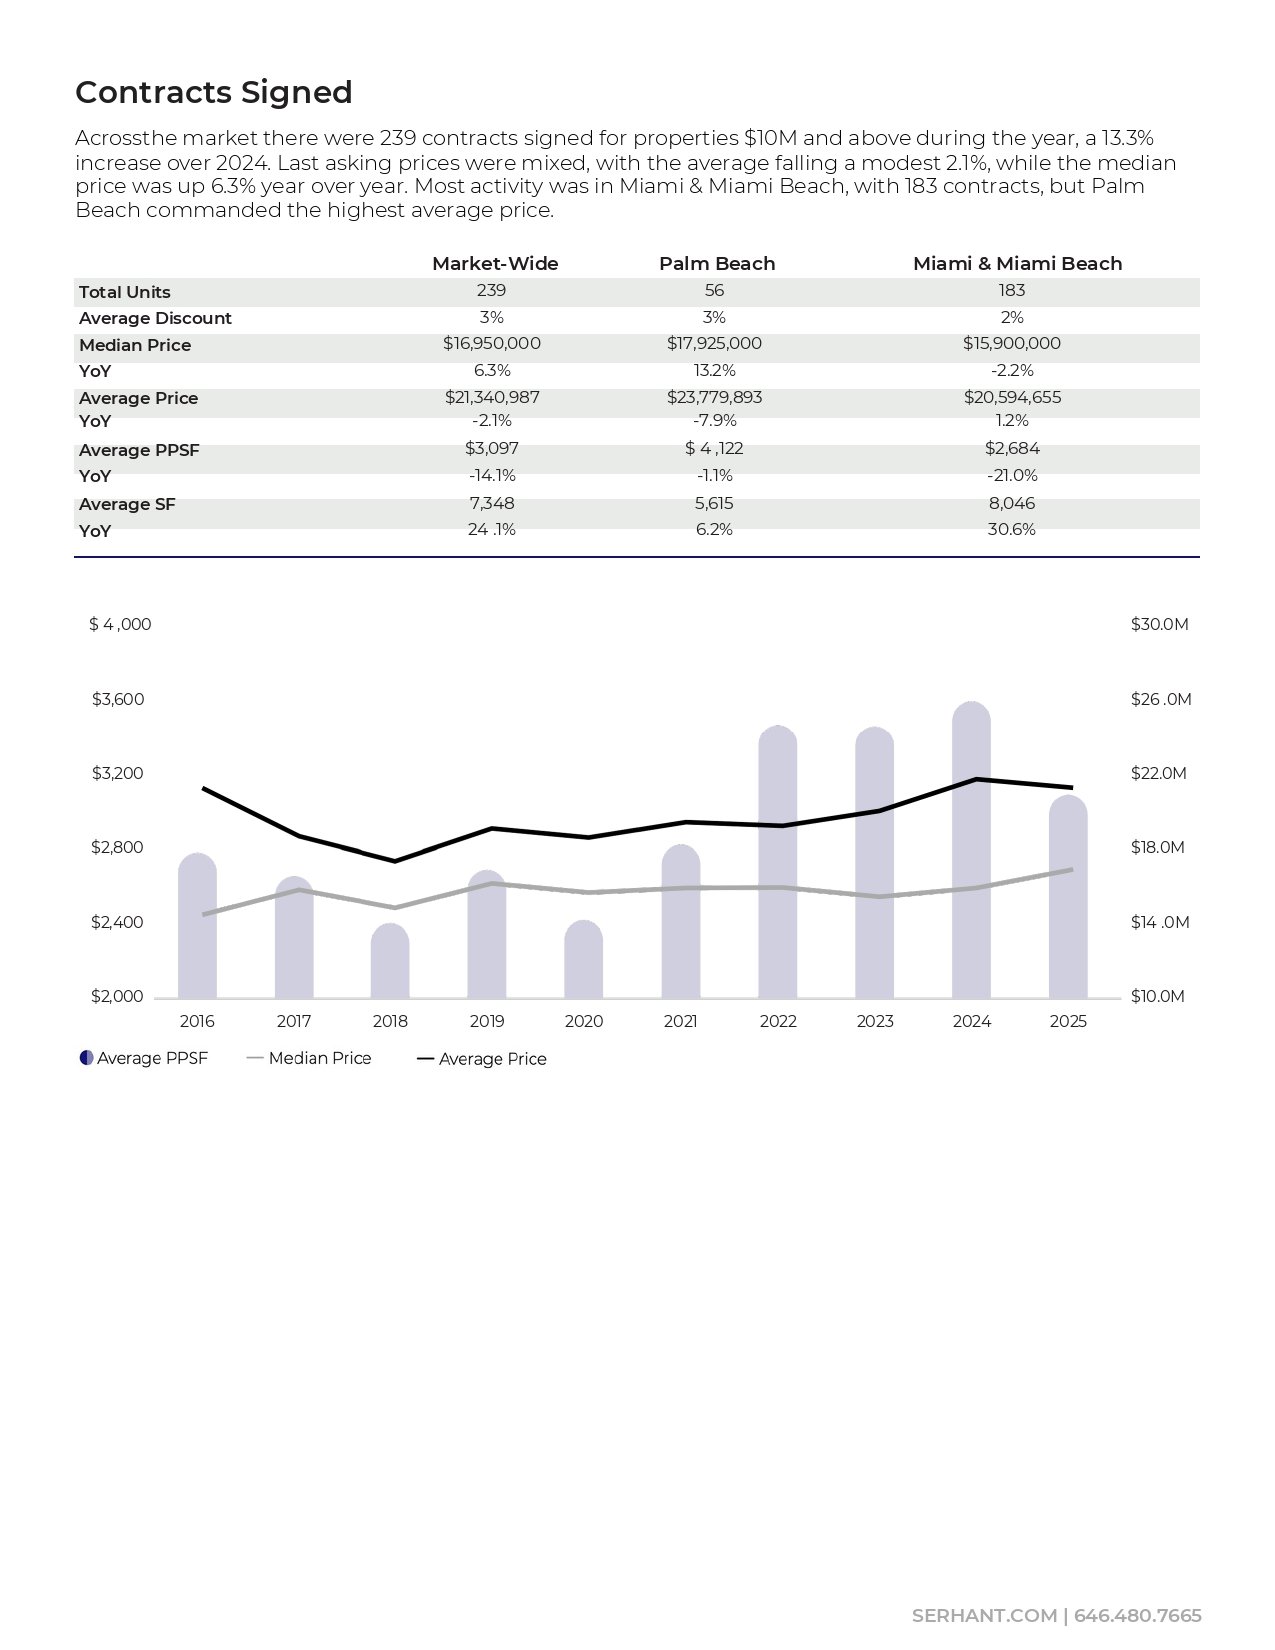
Real estate market infographic comparing luxury contracts, prices, and price per square foot across 2016–2025.

SERHANT. market report disclosure page with research contact details and legal disclaimer.

Townhouse Full Year Report

Celeste Pandhi Team 2025 townhouse full-year report cover

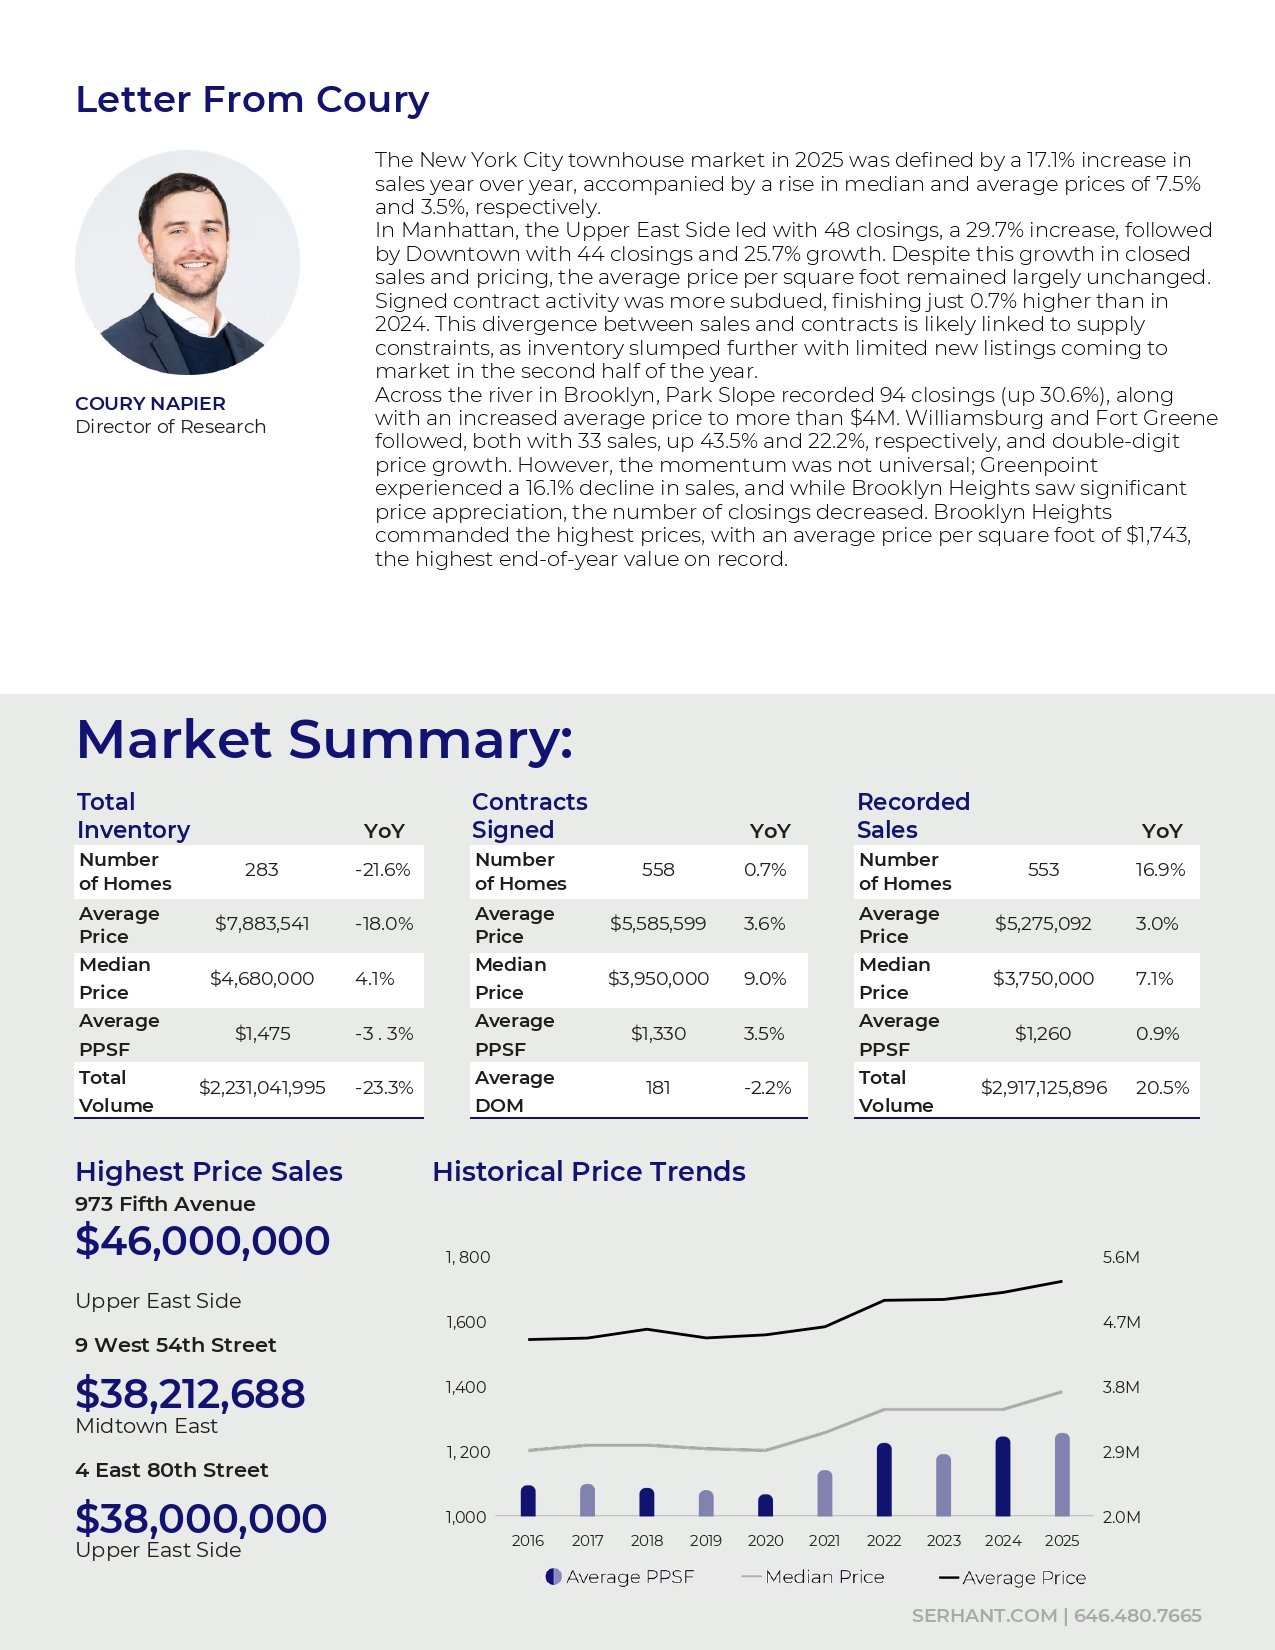
2025 New York City real estate market infographic with sales statistics, top sales, and historical price trends.

Manhattan

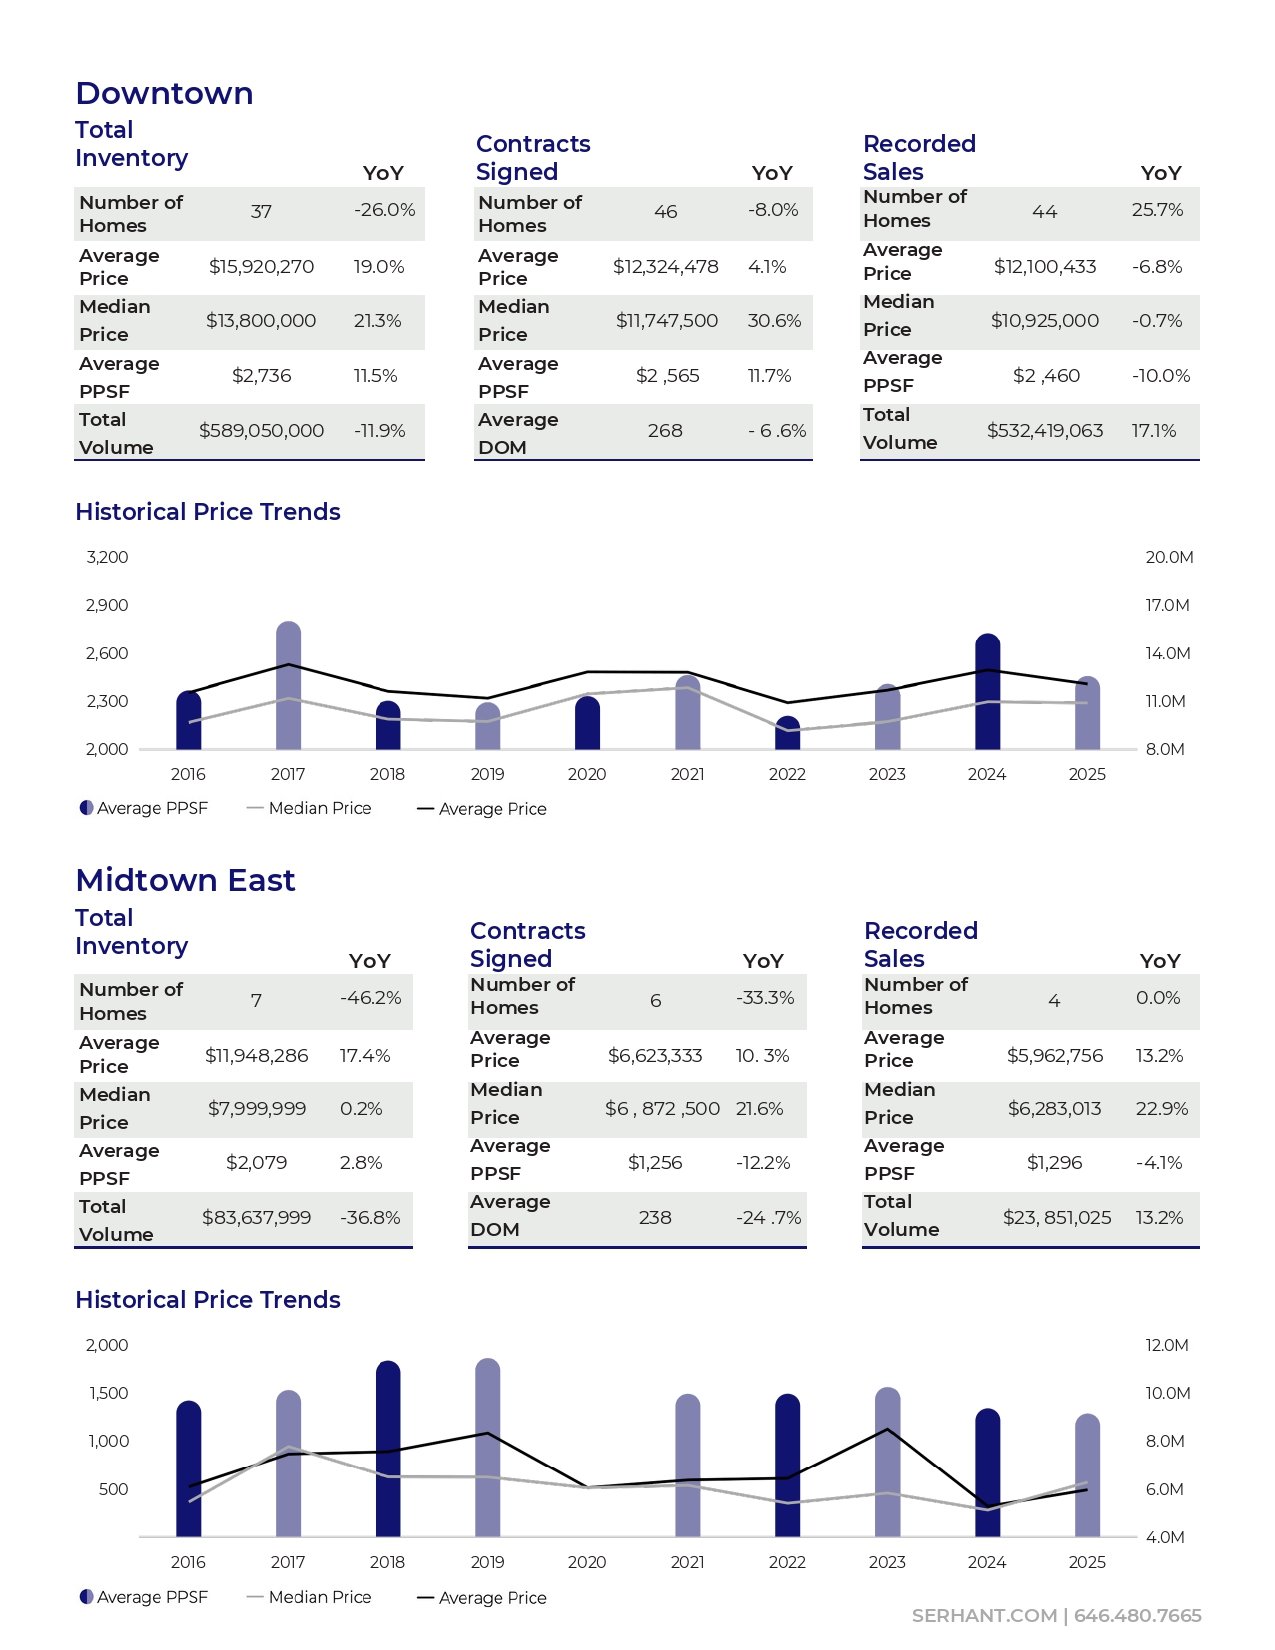
Downtown and Midtown East real estate market tables and historical price trend charts, 2016–2025.

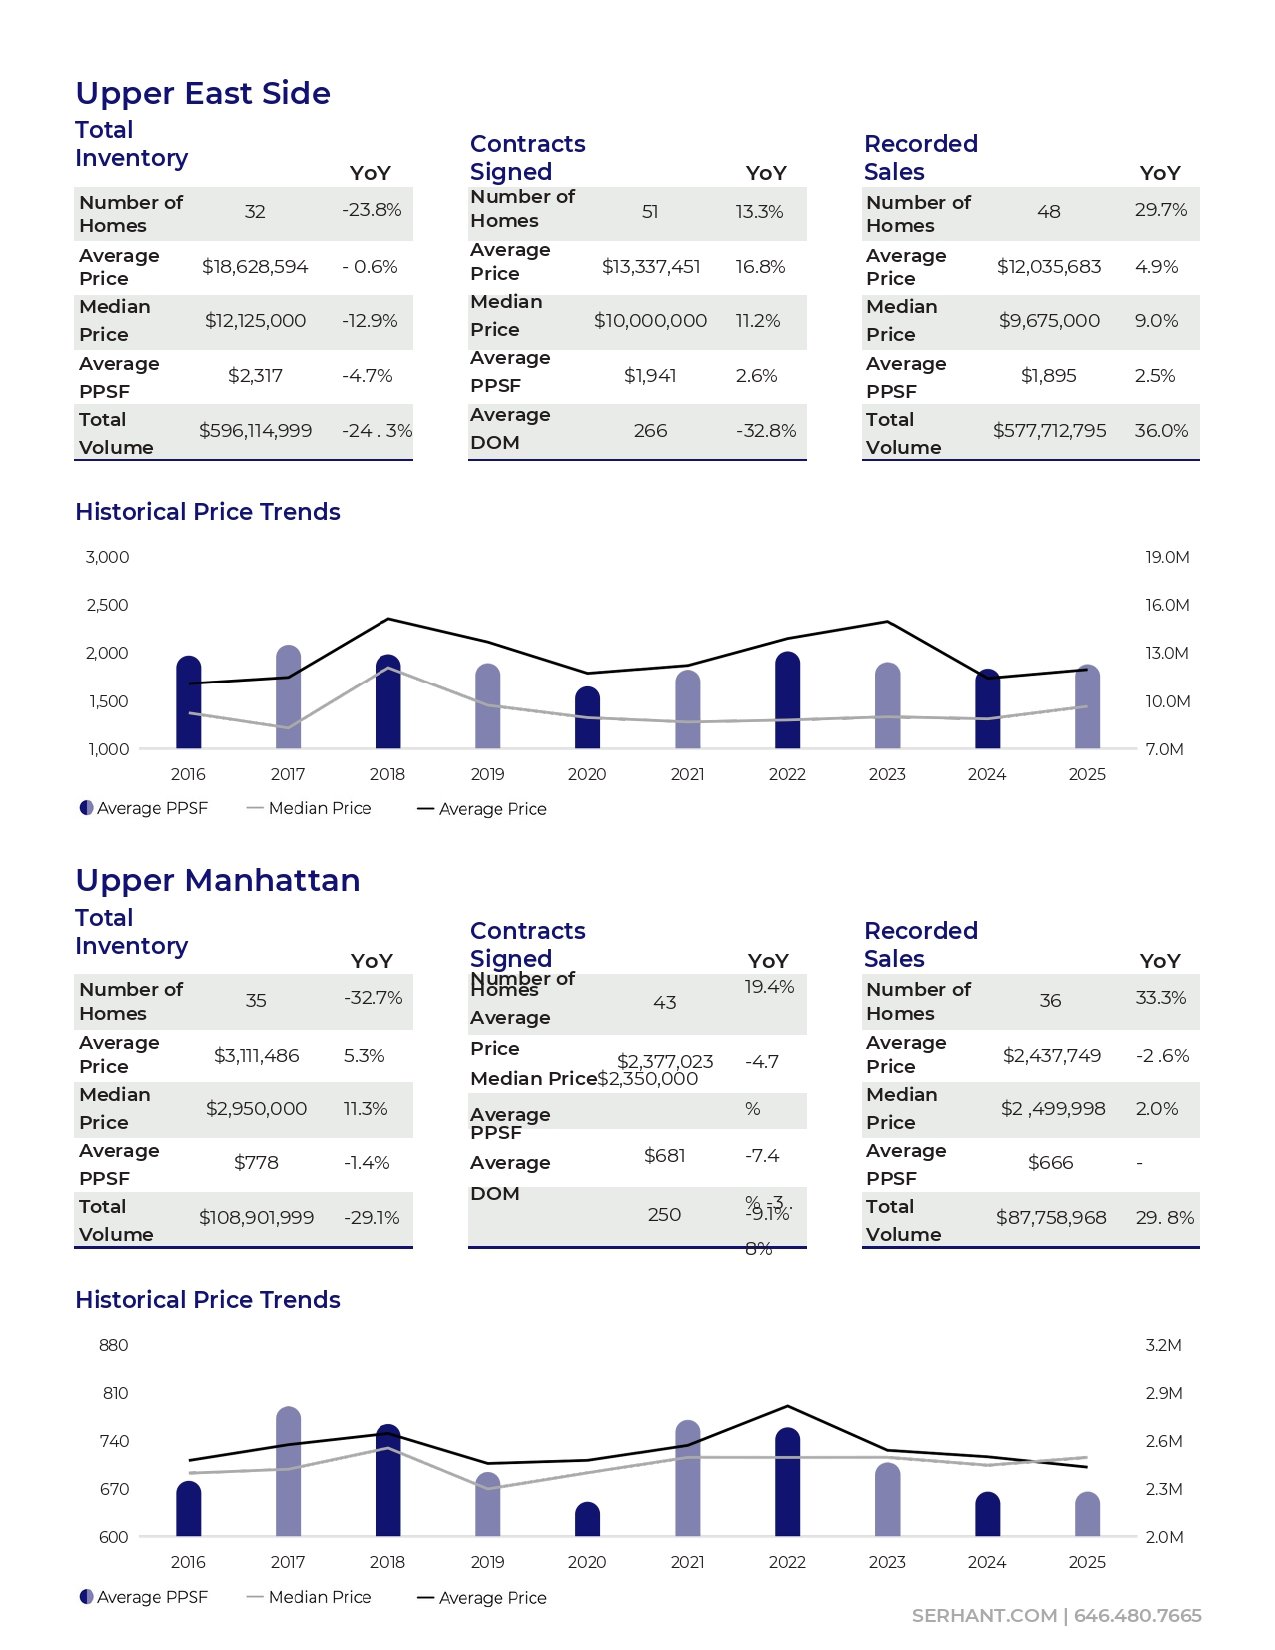
Market update for the Upper East Side and Upper Manhattan, with sales statistics and historical price trend charts.

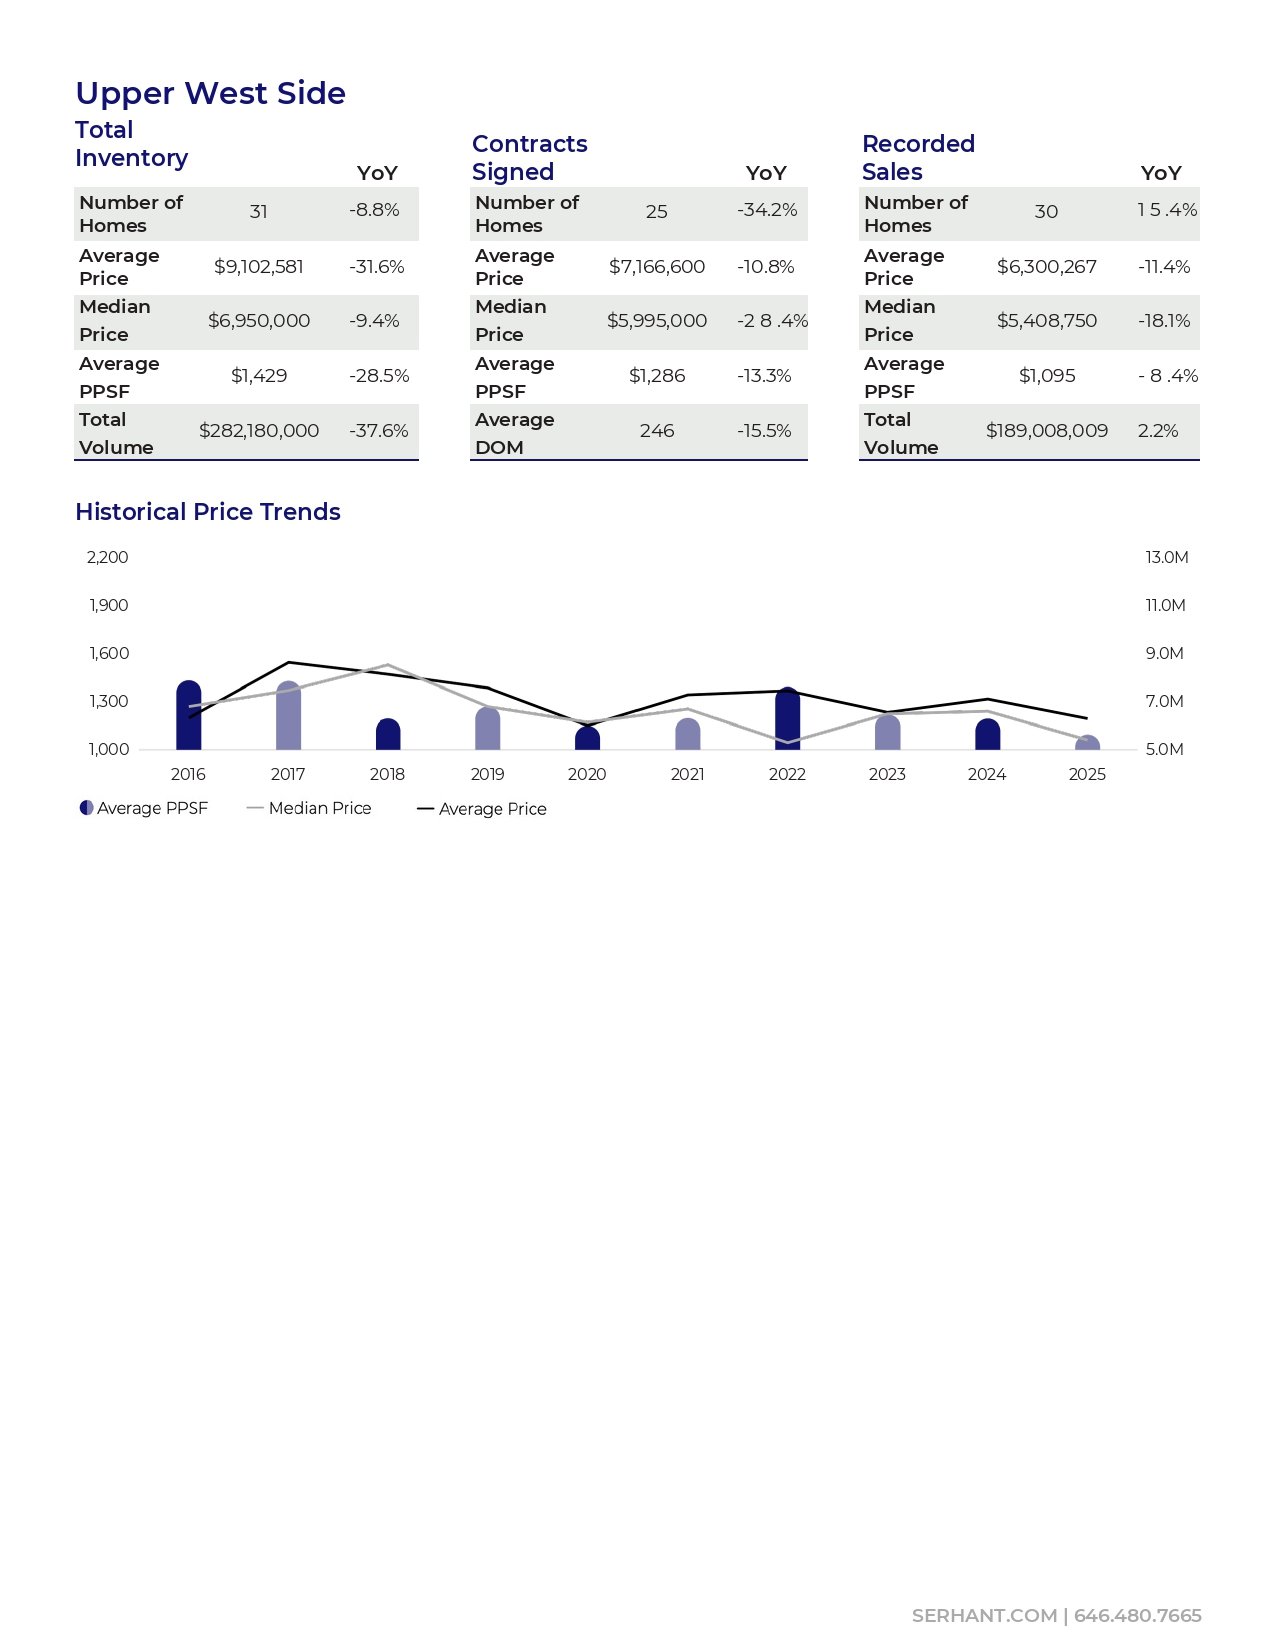
Upper West Side market infographic with inventory, contract, sales statistics, and a historical price trends chart.

Brooklyn, over a blue-tinted view of an ornate brownstone facade and stoop.

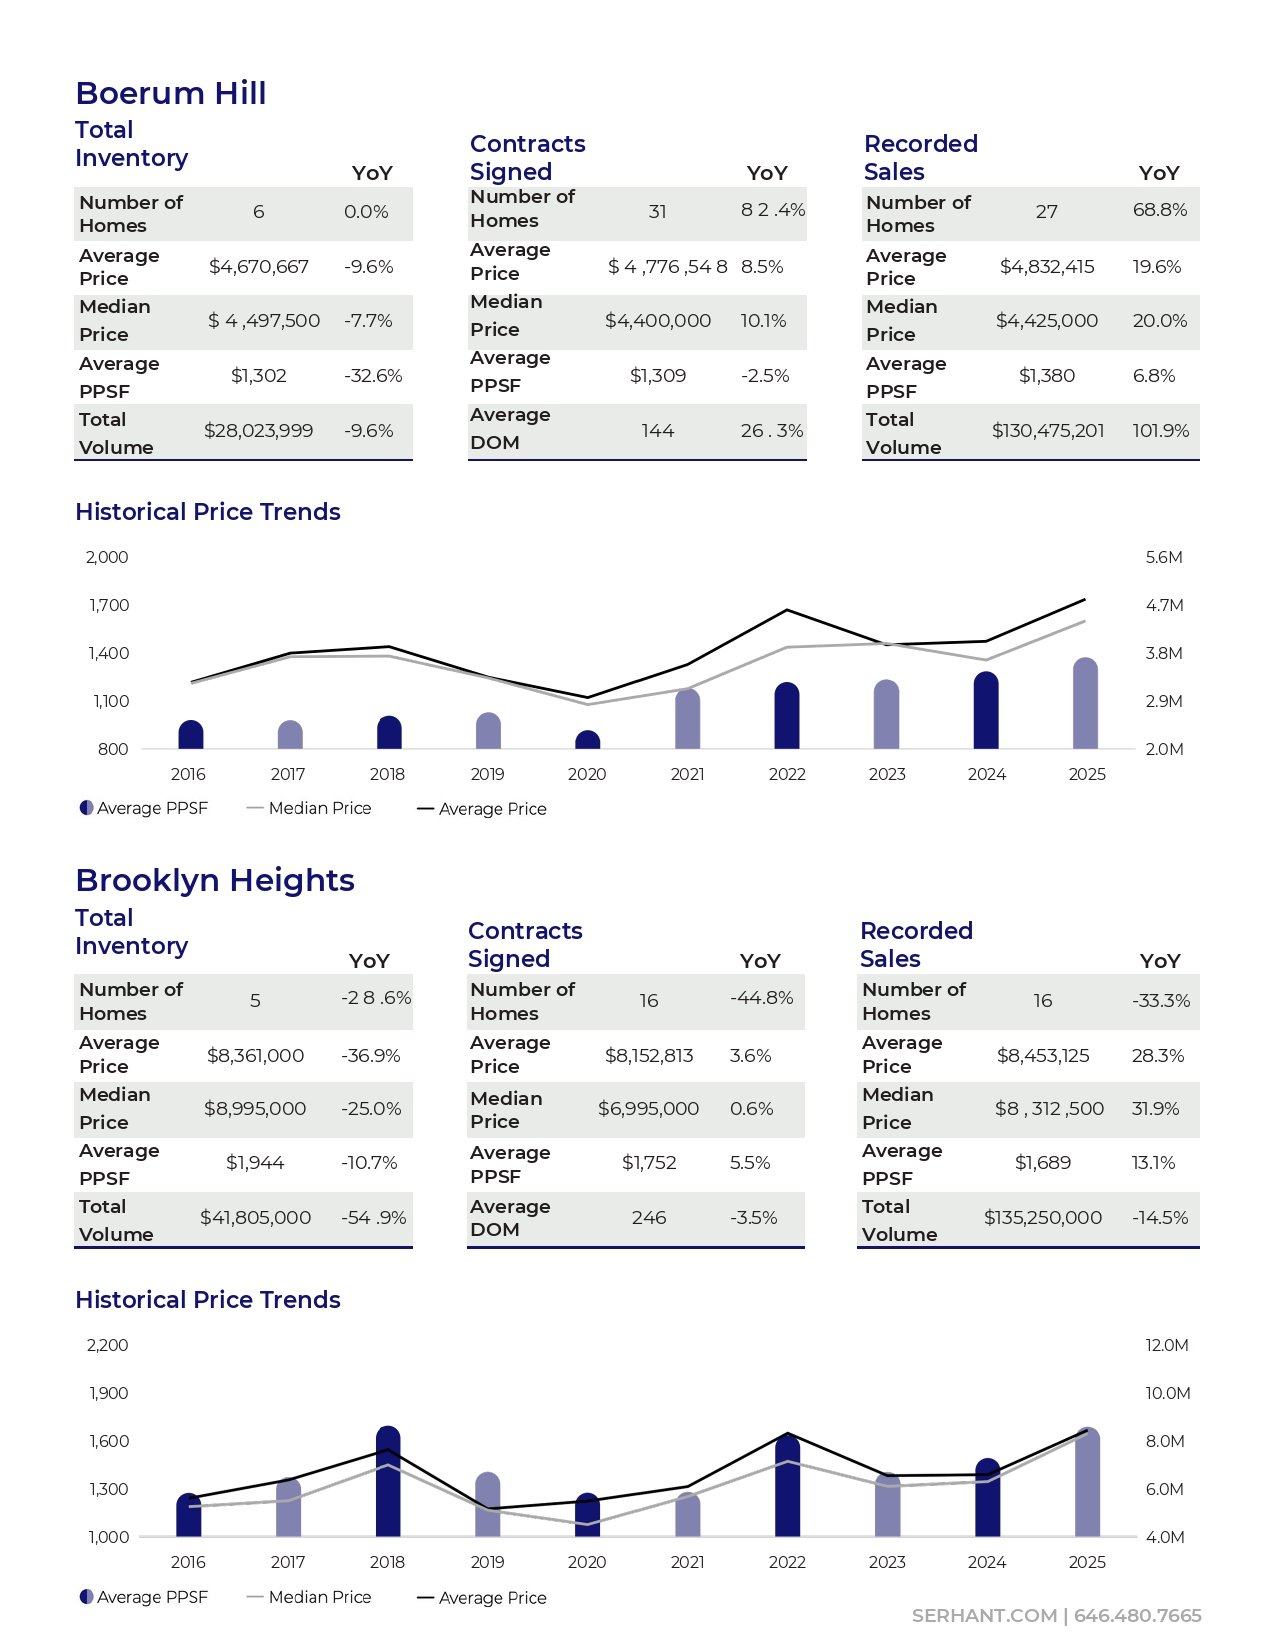
Real estate market infographic comparing Boerum Hill and Brooklyn Heights statistics and price trends from 2016 to 2025.

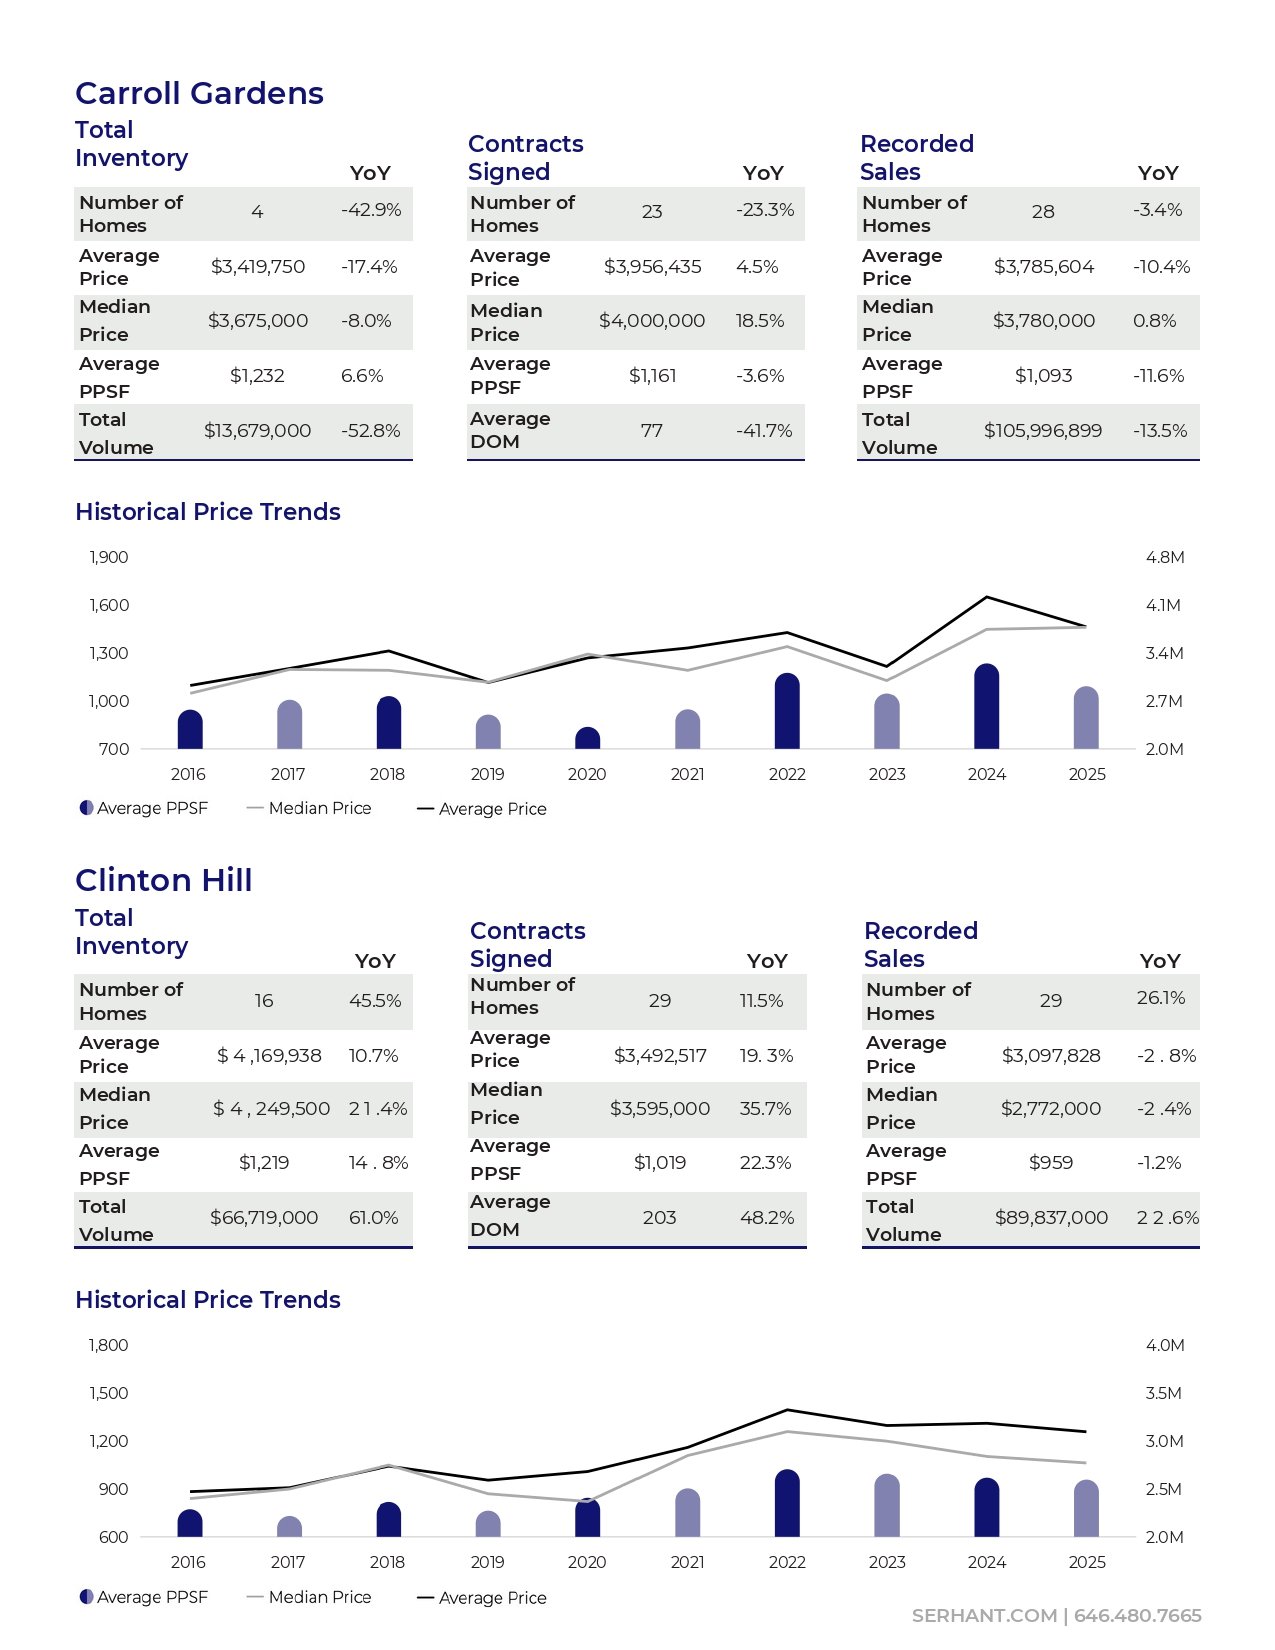
Carroll Gardens and Clinton Hill real estate market statistics and historical price trends for 2016–2025.

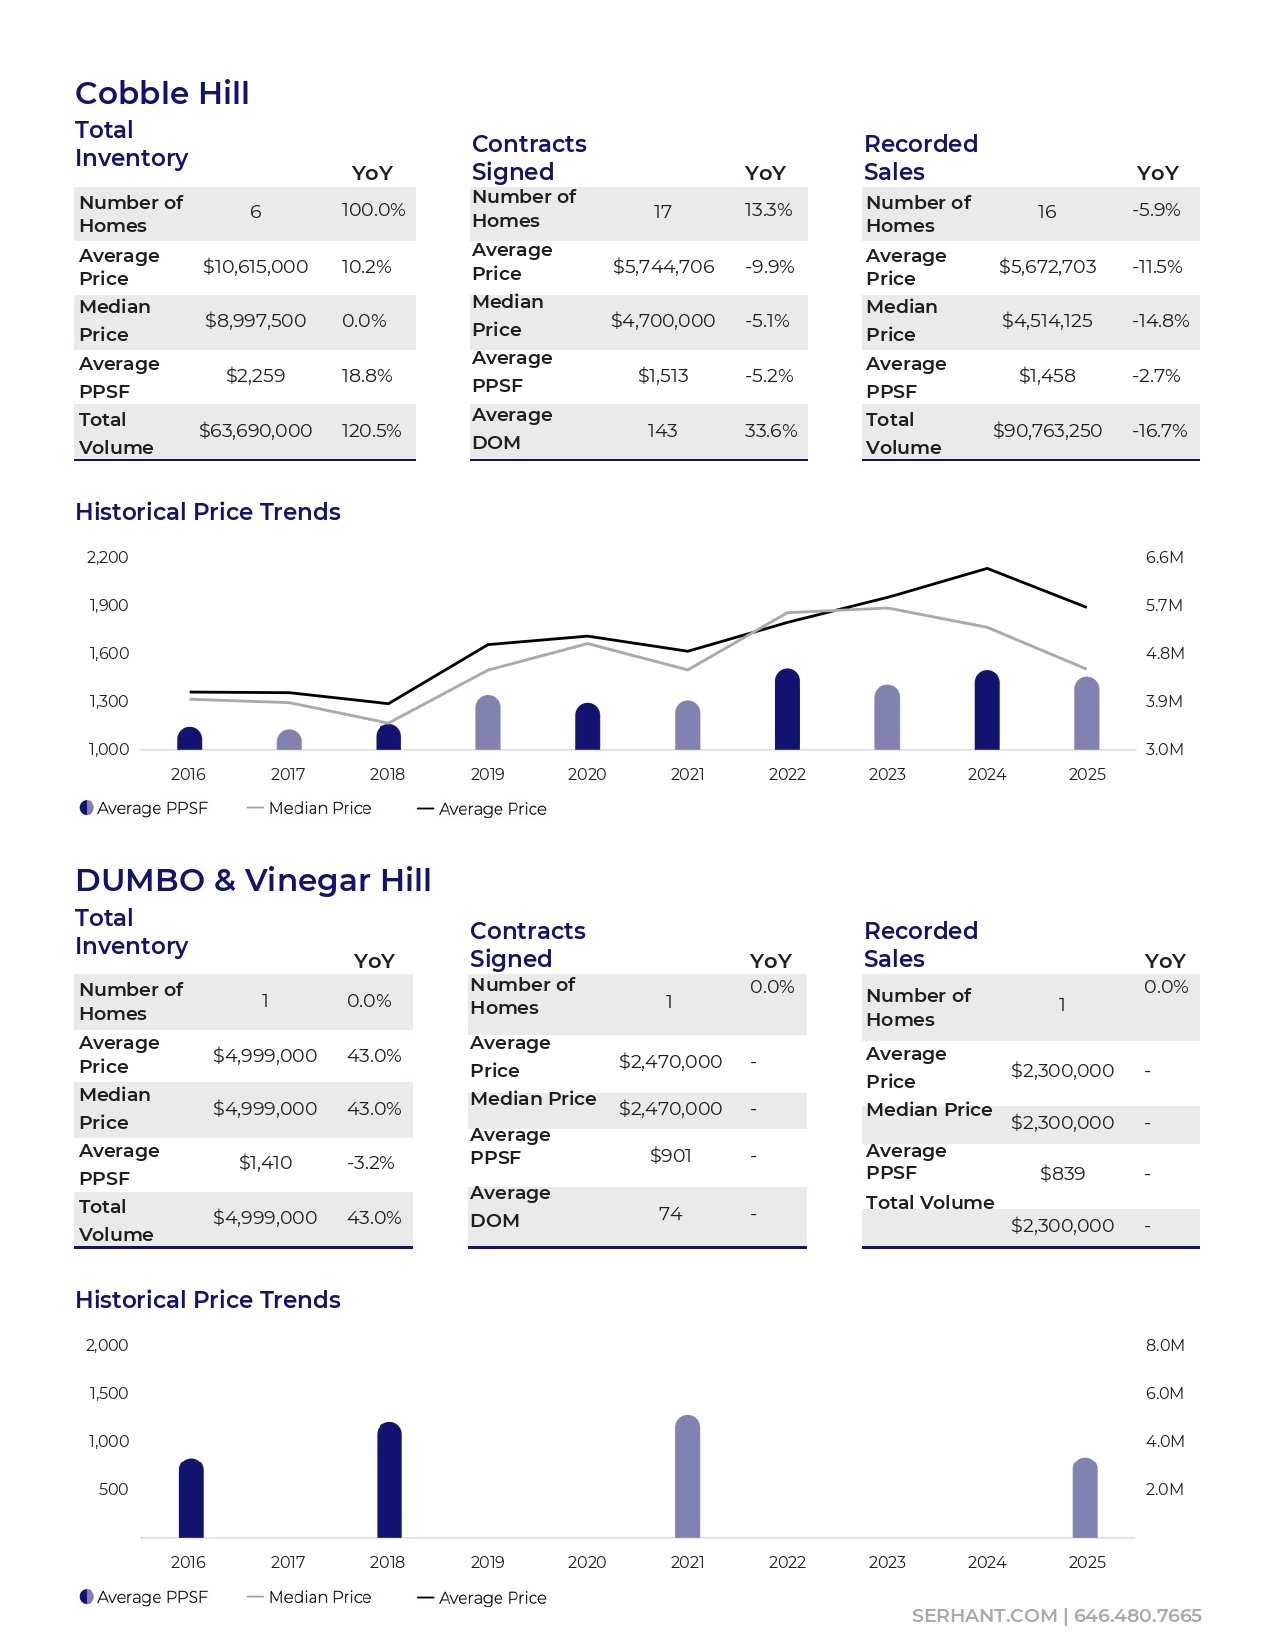
Market statistics and historical price trends for Cobble Hill, DUMBO, and Vinegar Hill.

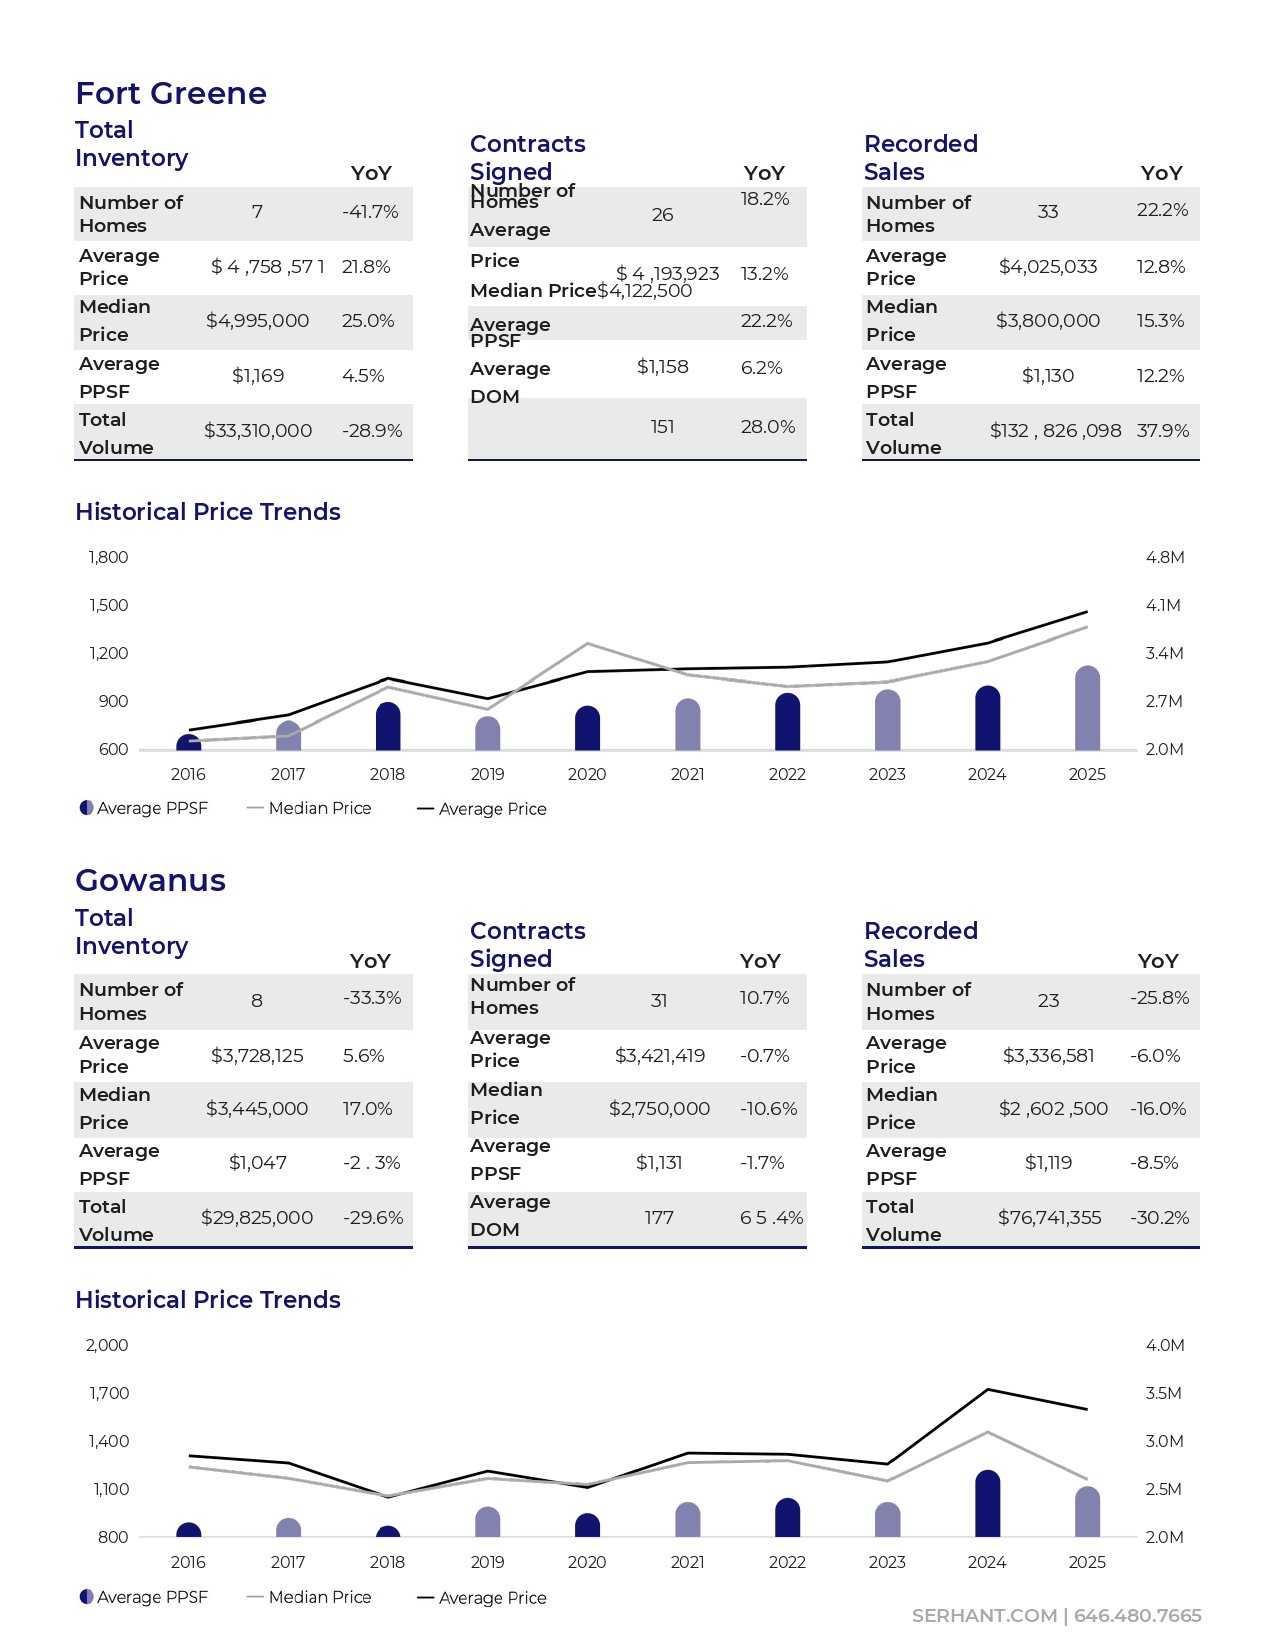
Market statistics for Fort Greene and Gowanus, with inventory, sales, year-over-year changes, and historical price trend charts.

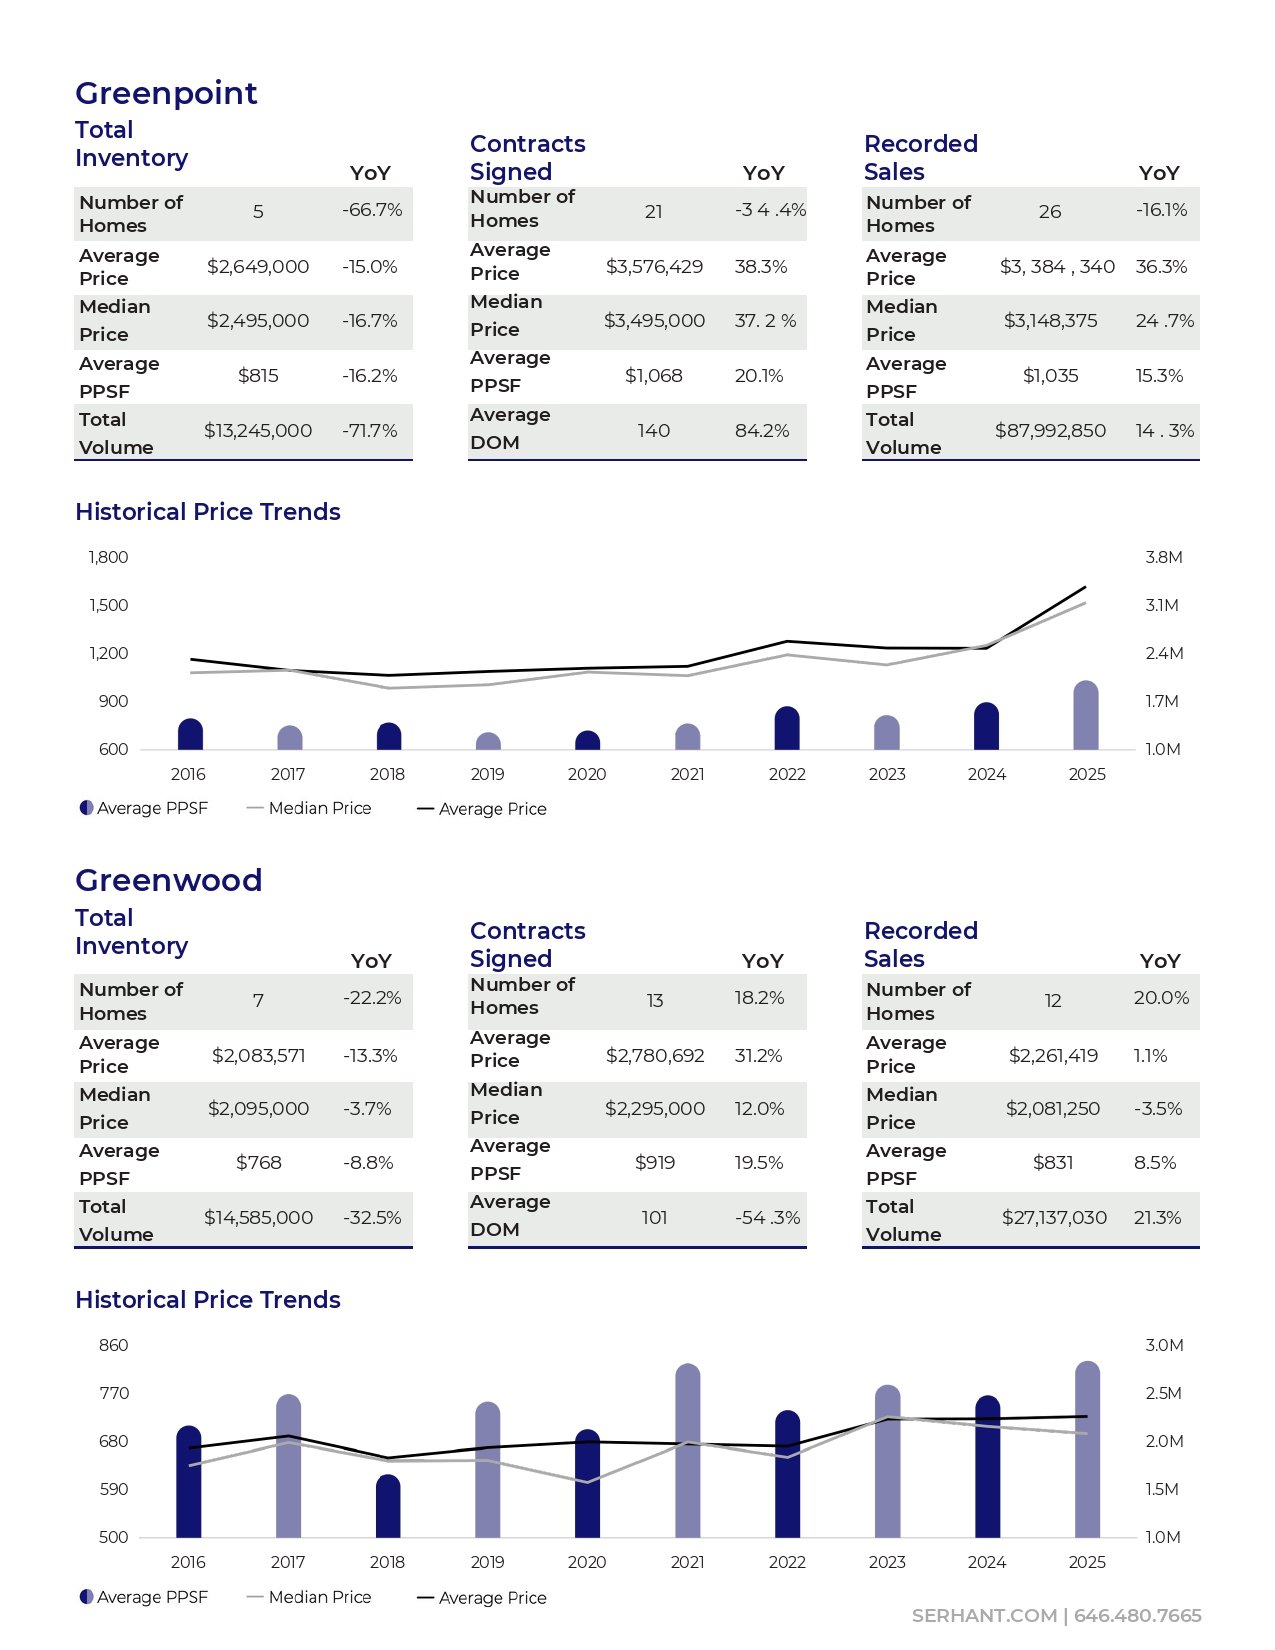
Greenpoint and Greenwood real estate statistics with historical price trend charts from 2016 to 2025.

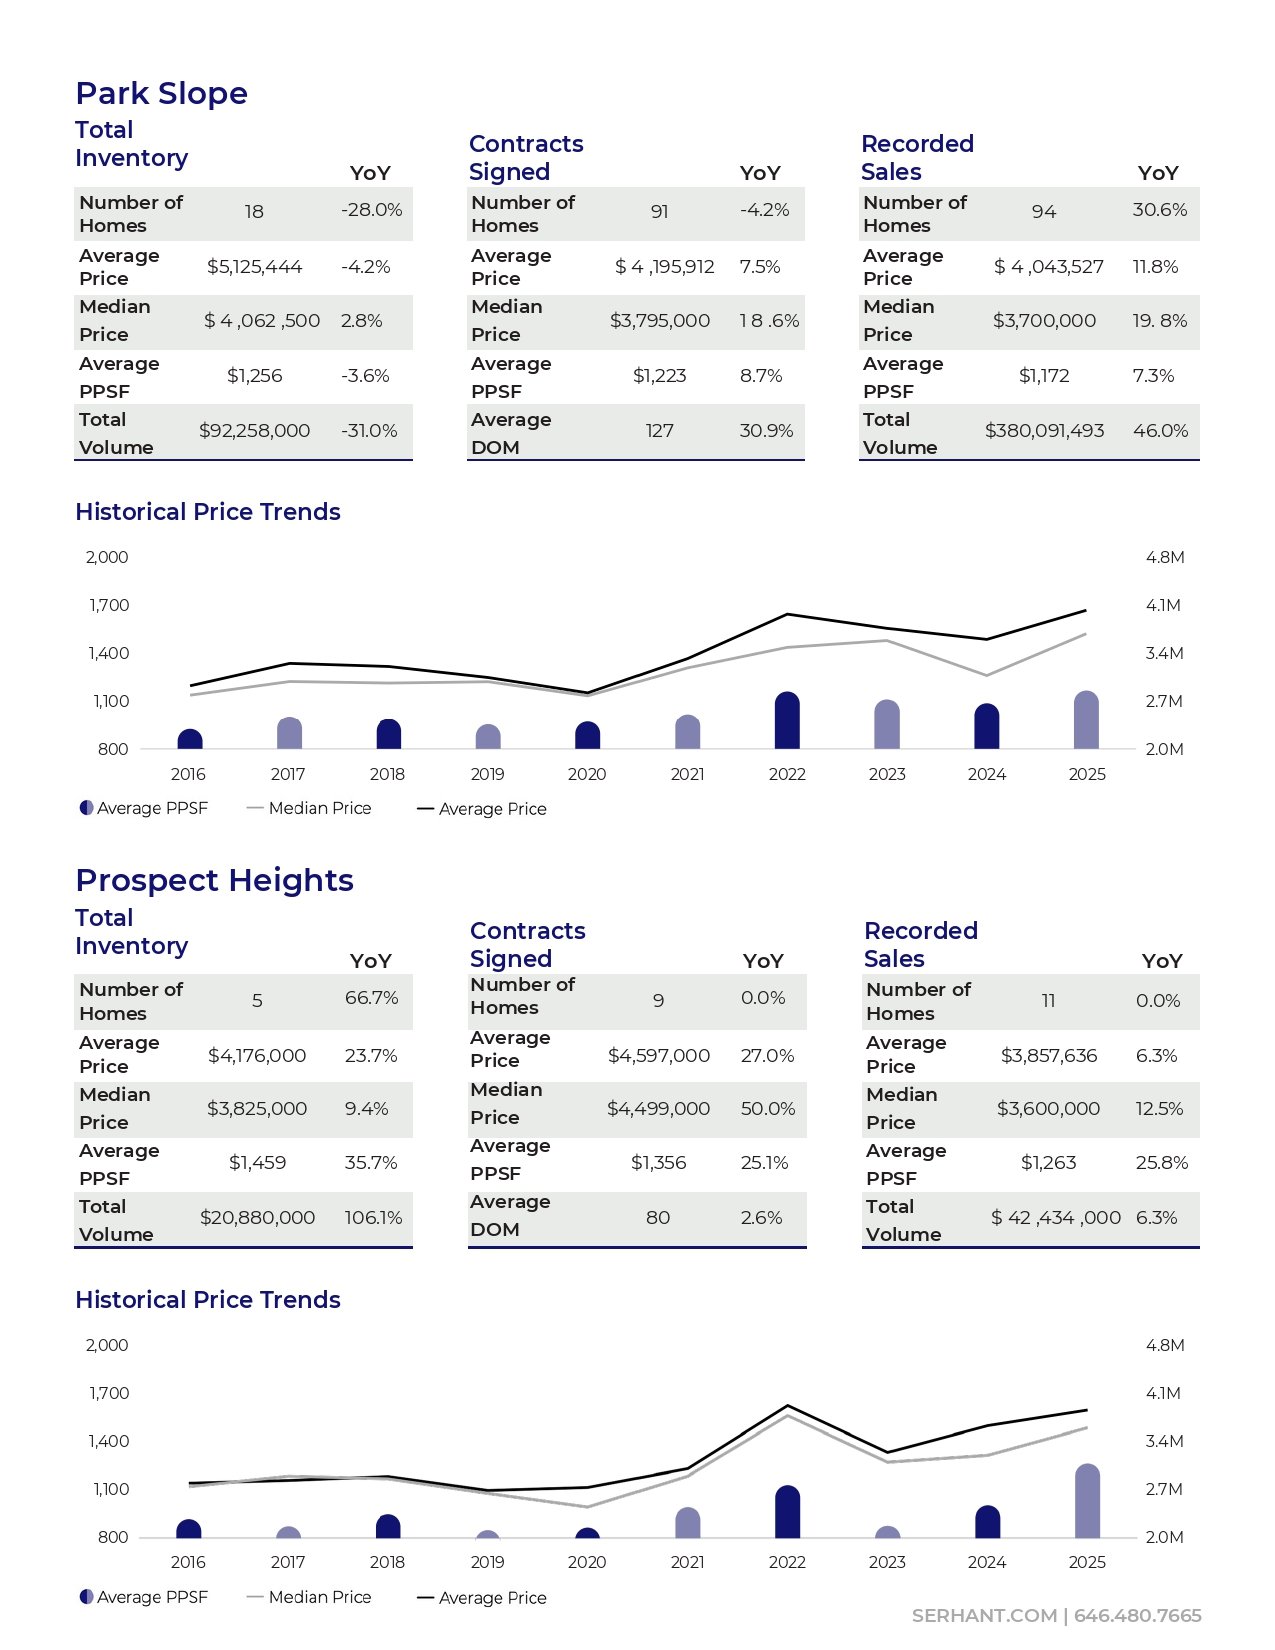
Park Slope and Prospect Heights real estate market statistics, with sales tables and historical price trend charts.

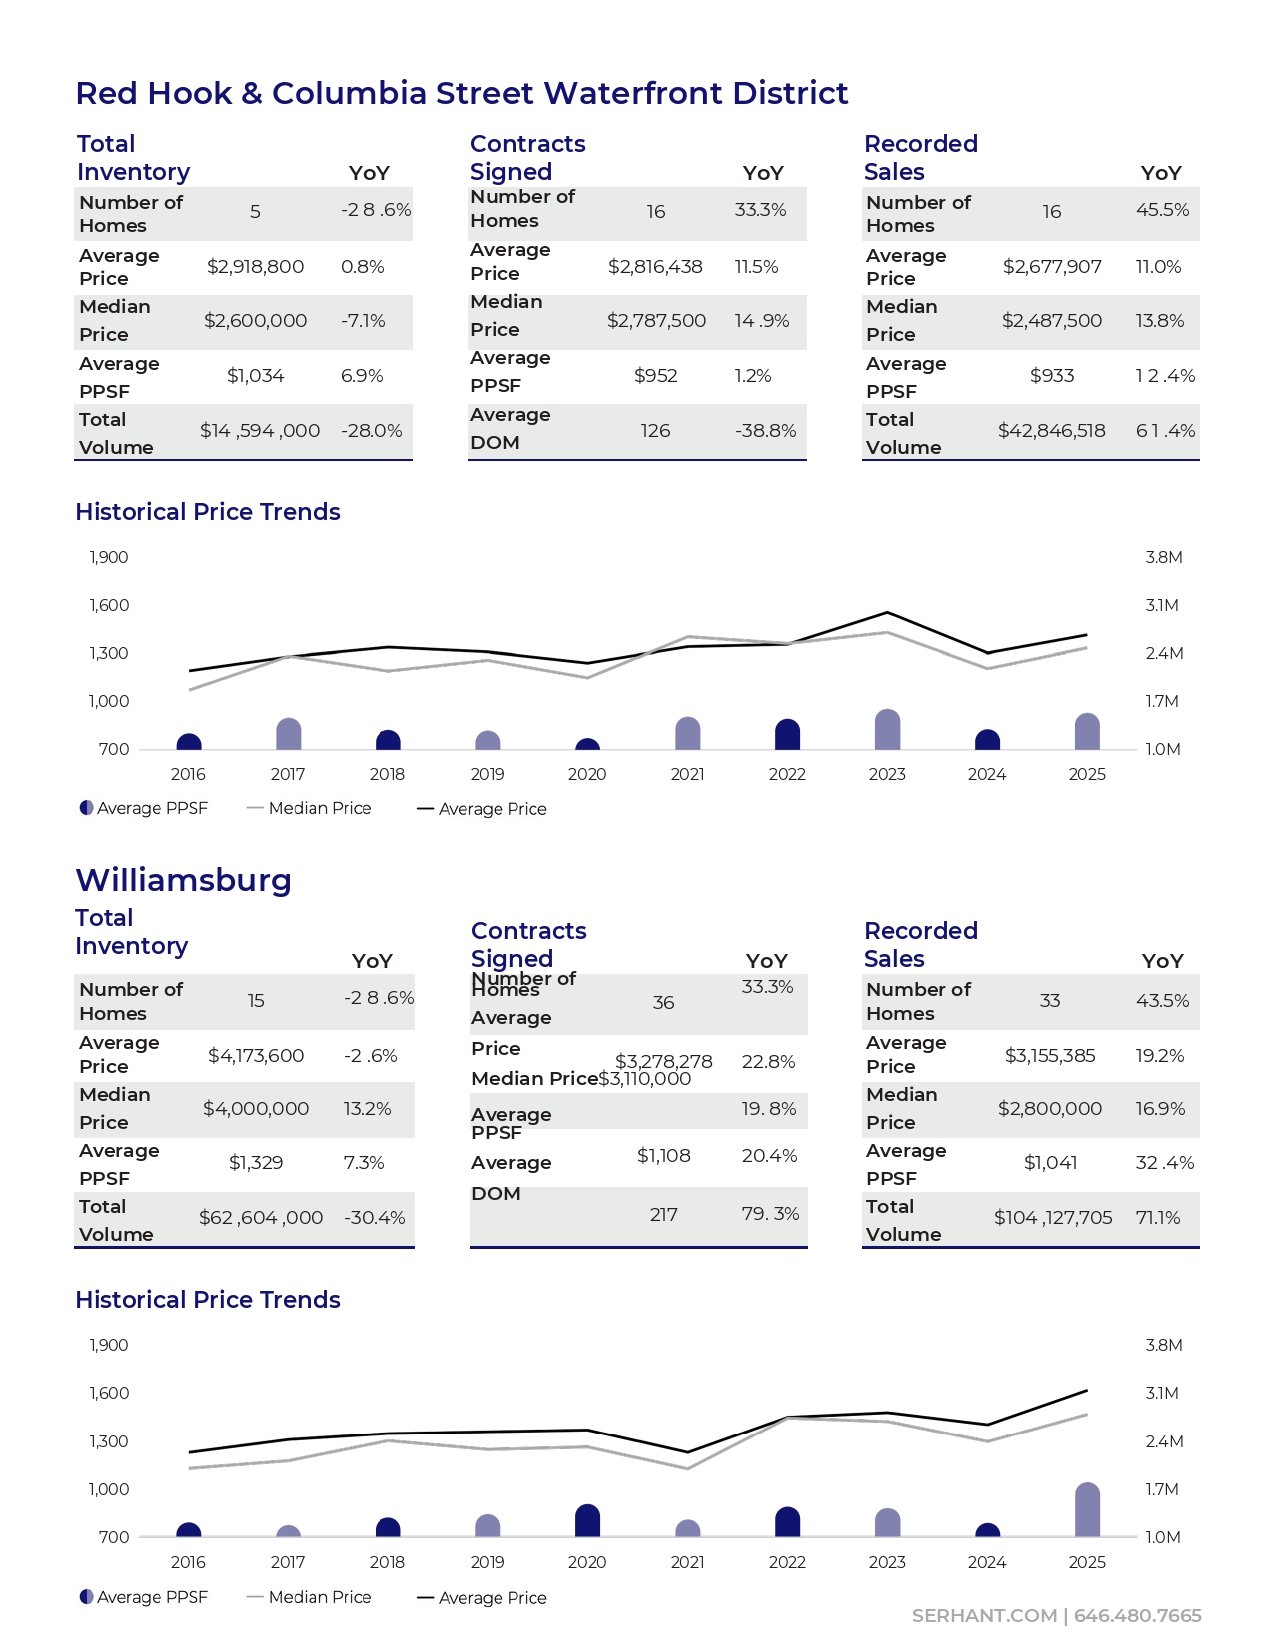
Brooklyn market infographic comparing Red Hook, Columbia Street Waterfront District, and Williamsburg from 2016 to 2025.

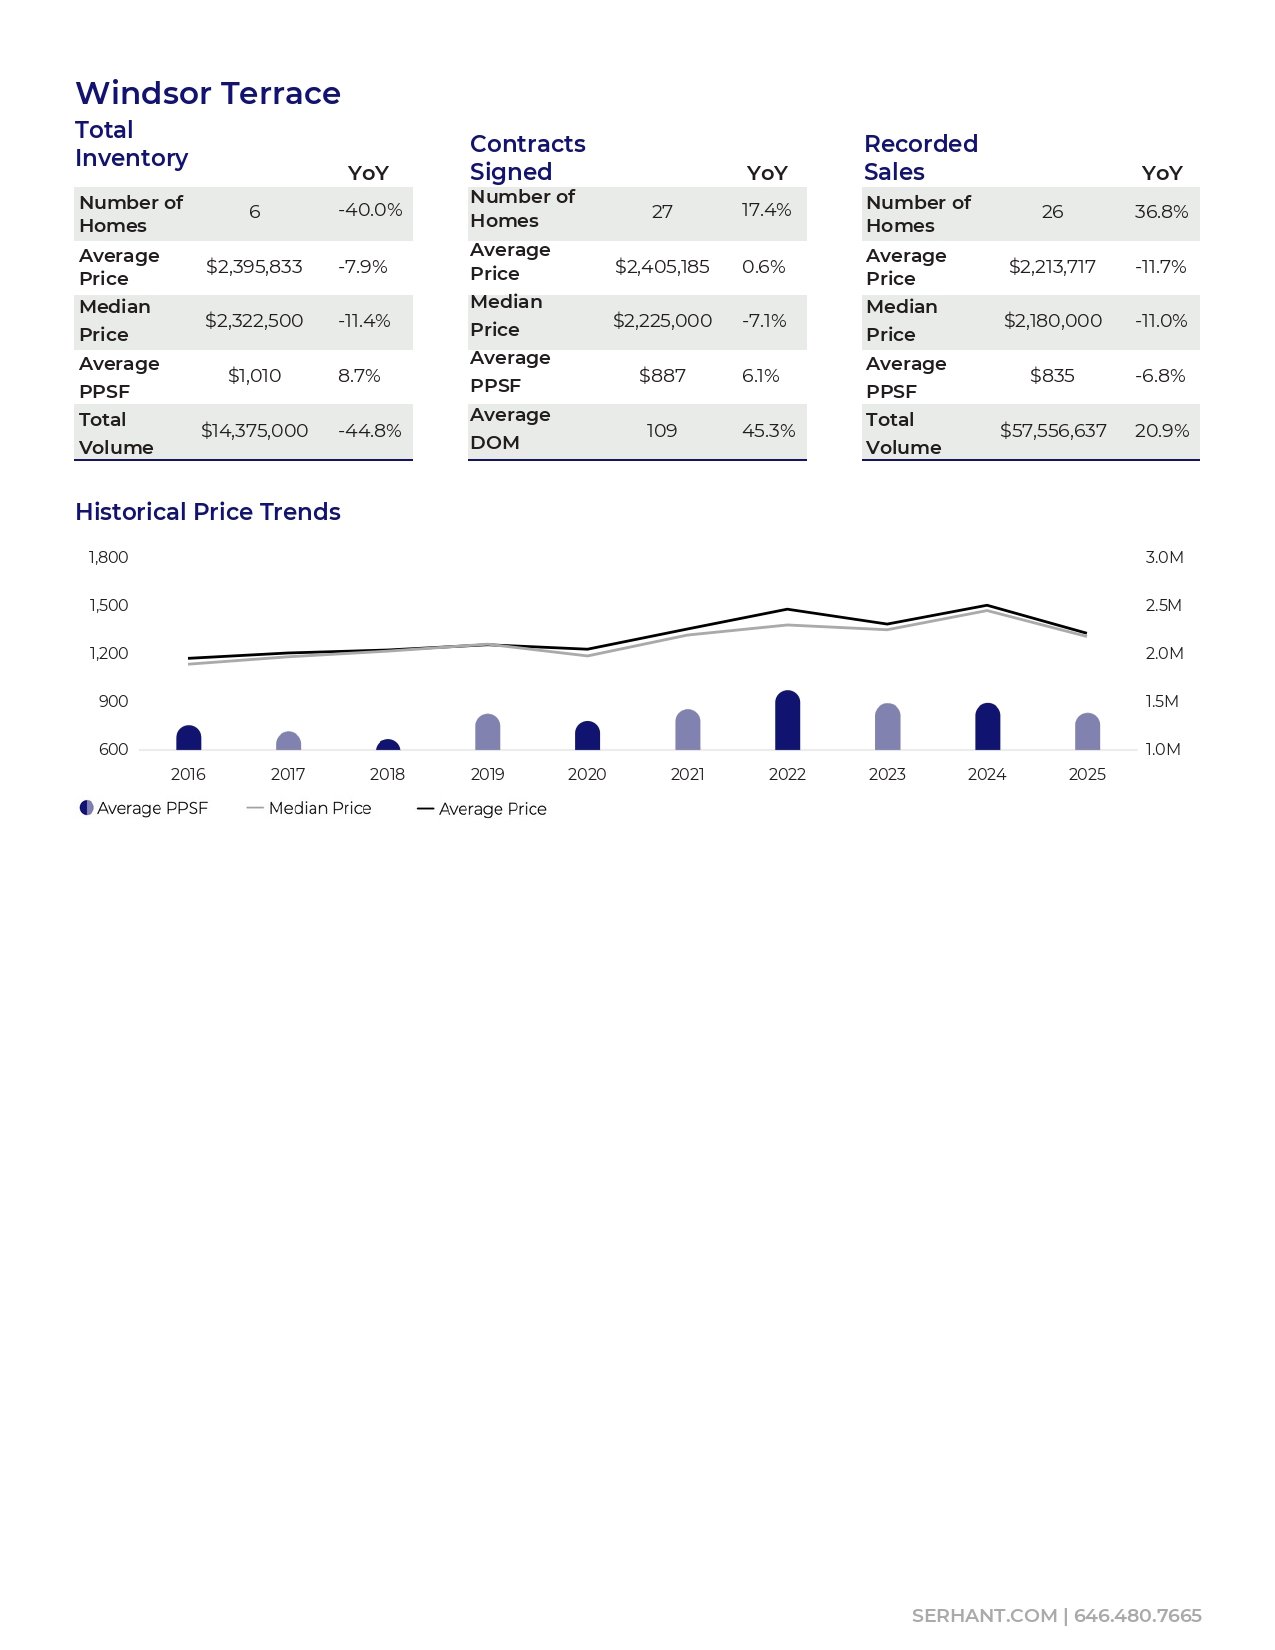
Windsor Terrace market statistics and historical price trends from 2016 to 2025.

SERHANT. market-report disclaimer page with Coury Napier’s research contact information.

Market Insights


New York City 

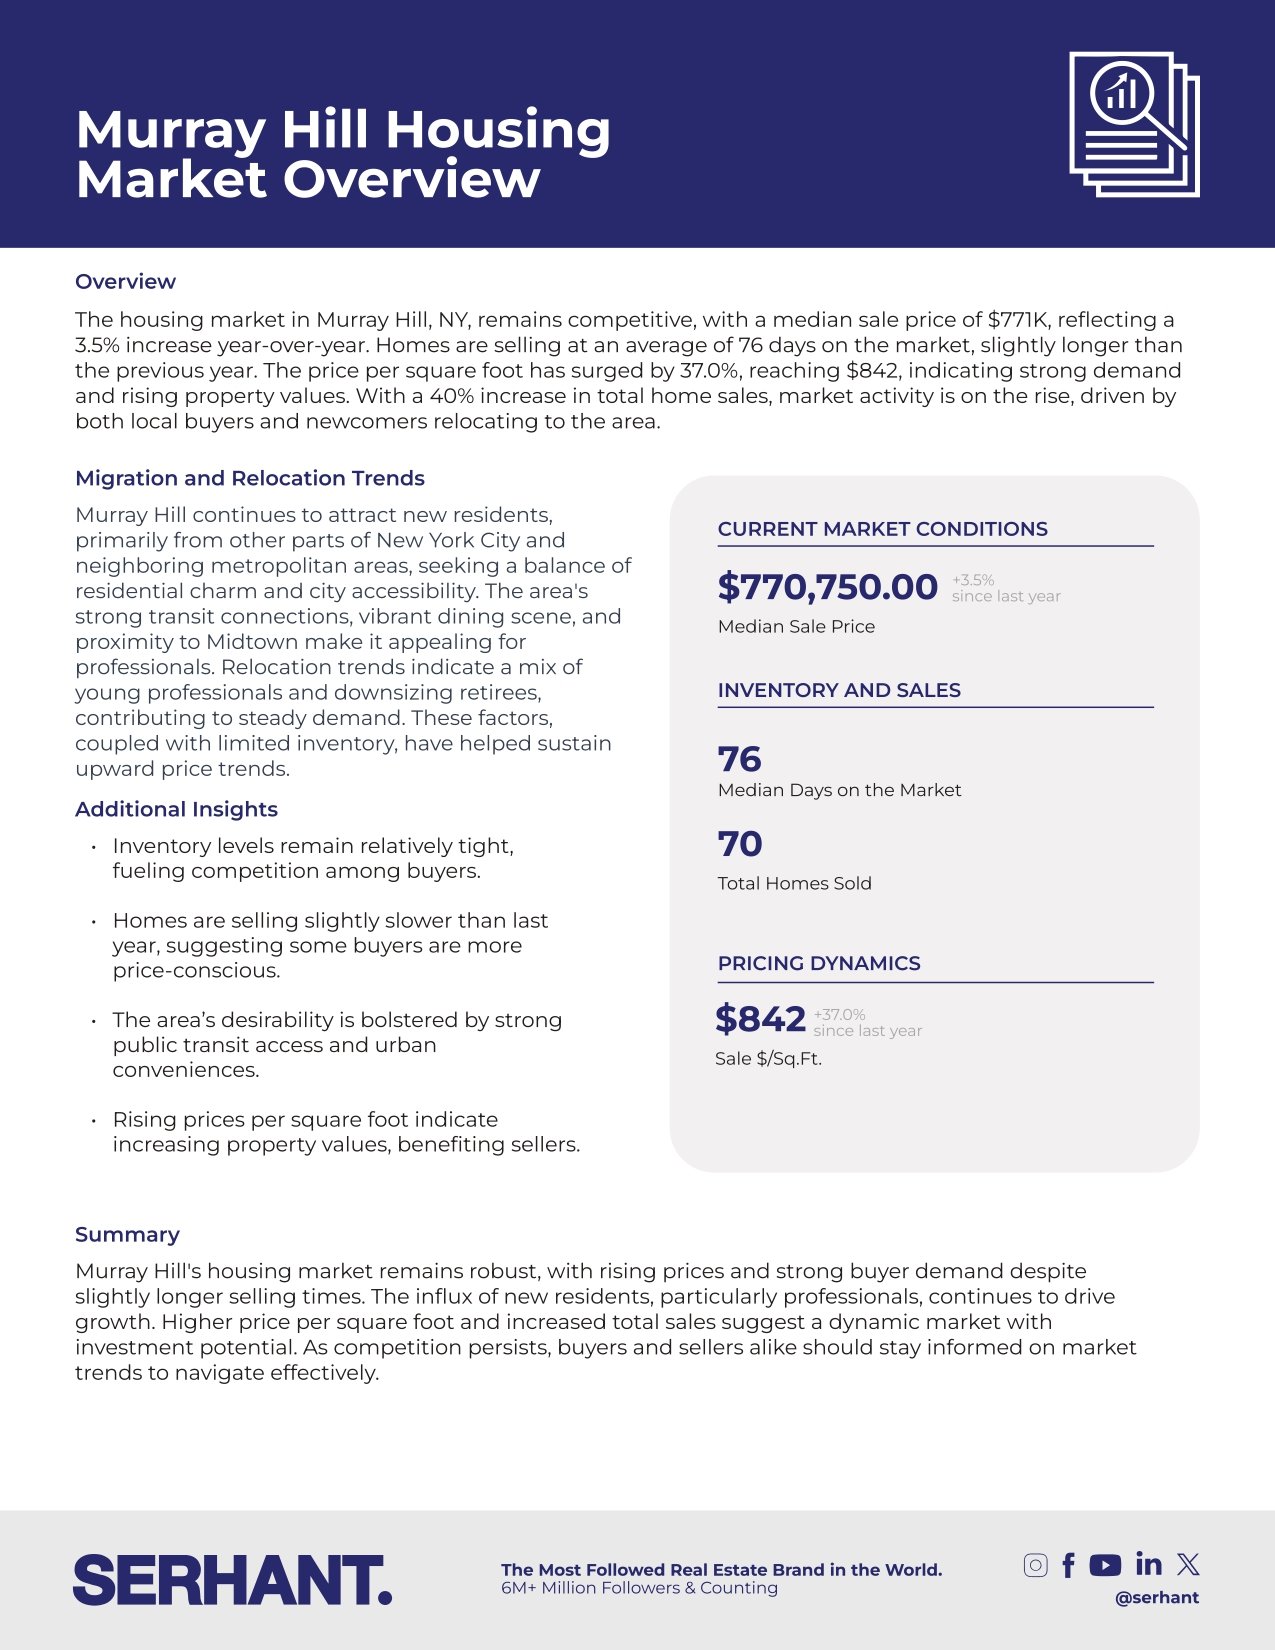
Murray Hill housing market infographic with median price, days on market, homes sold, and price-per-square-foot statistics.

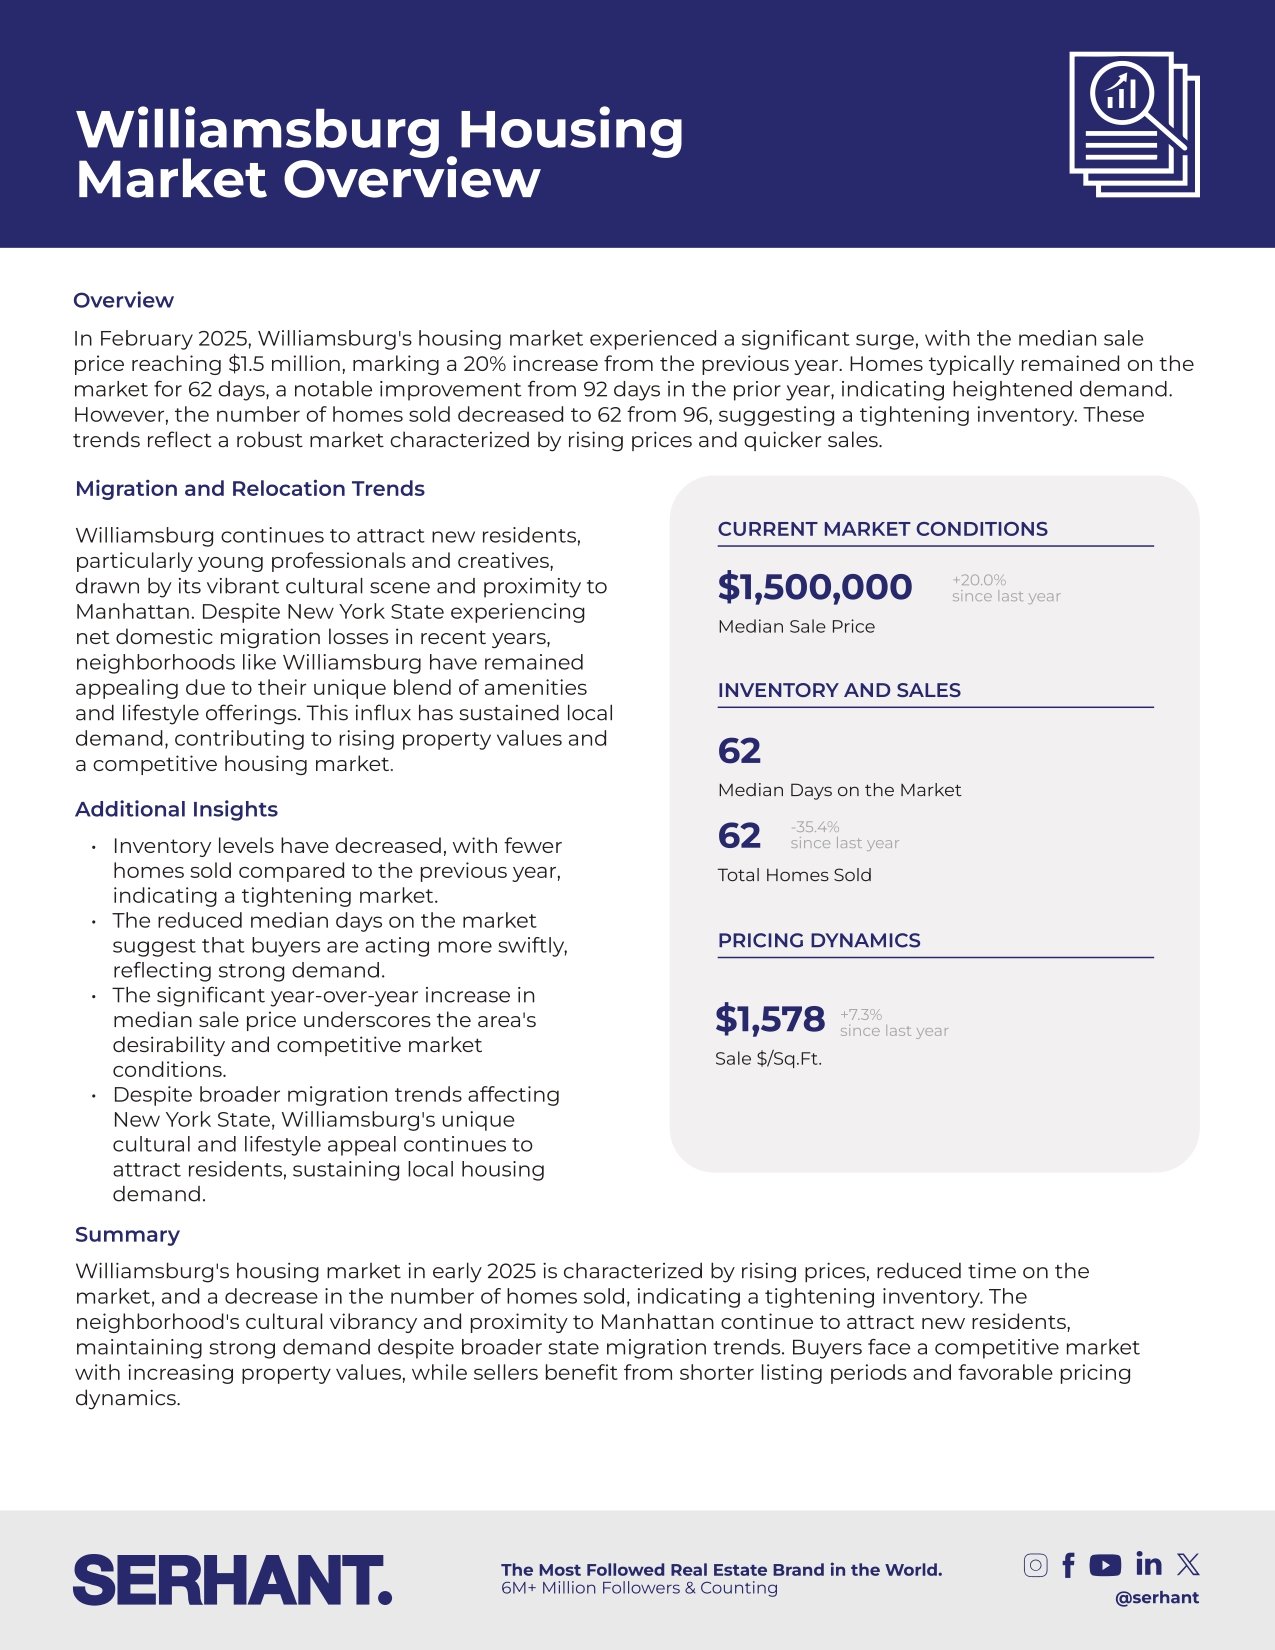
Williamsburg housing market infographic with 2025 prices, sales, days on market, and market commentary.

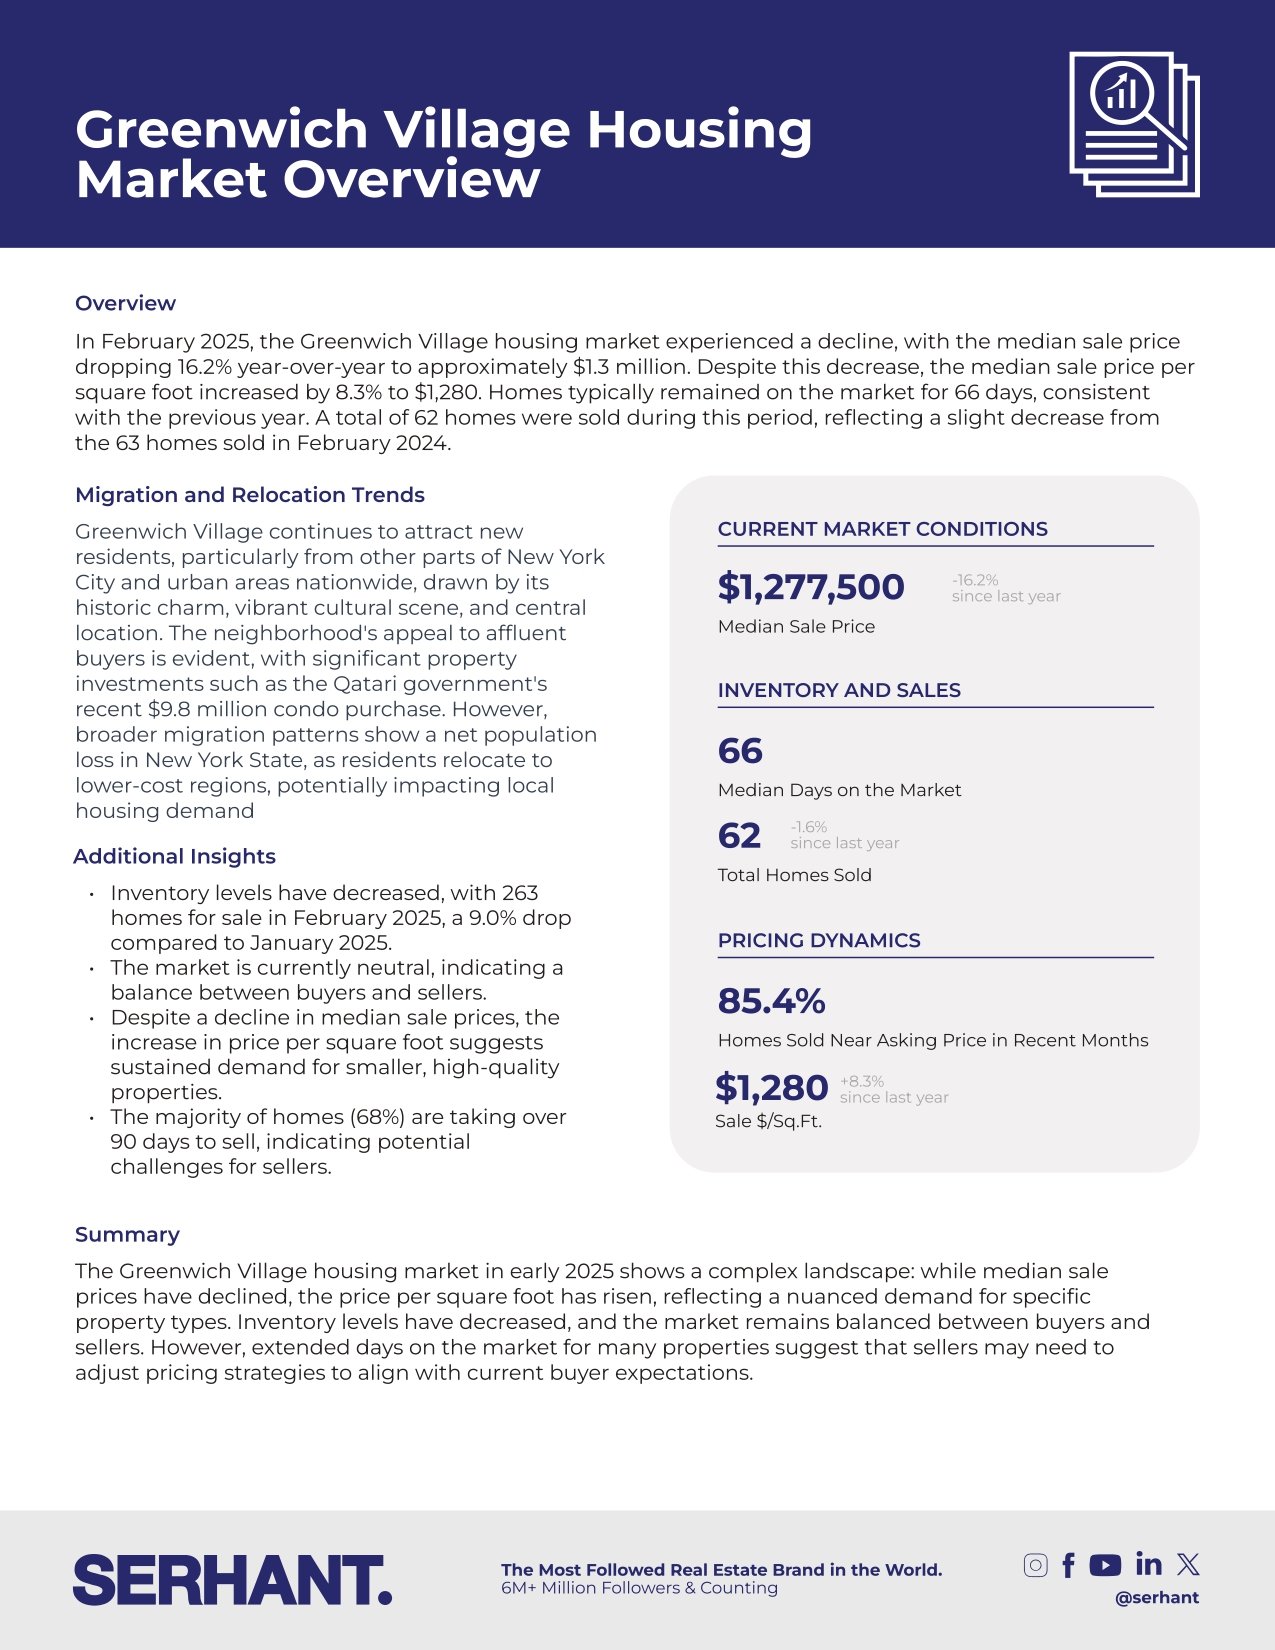
Greenwich Village housing market overview infographic with February 2025 prices, sales, inventory, and market trends.

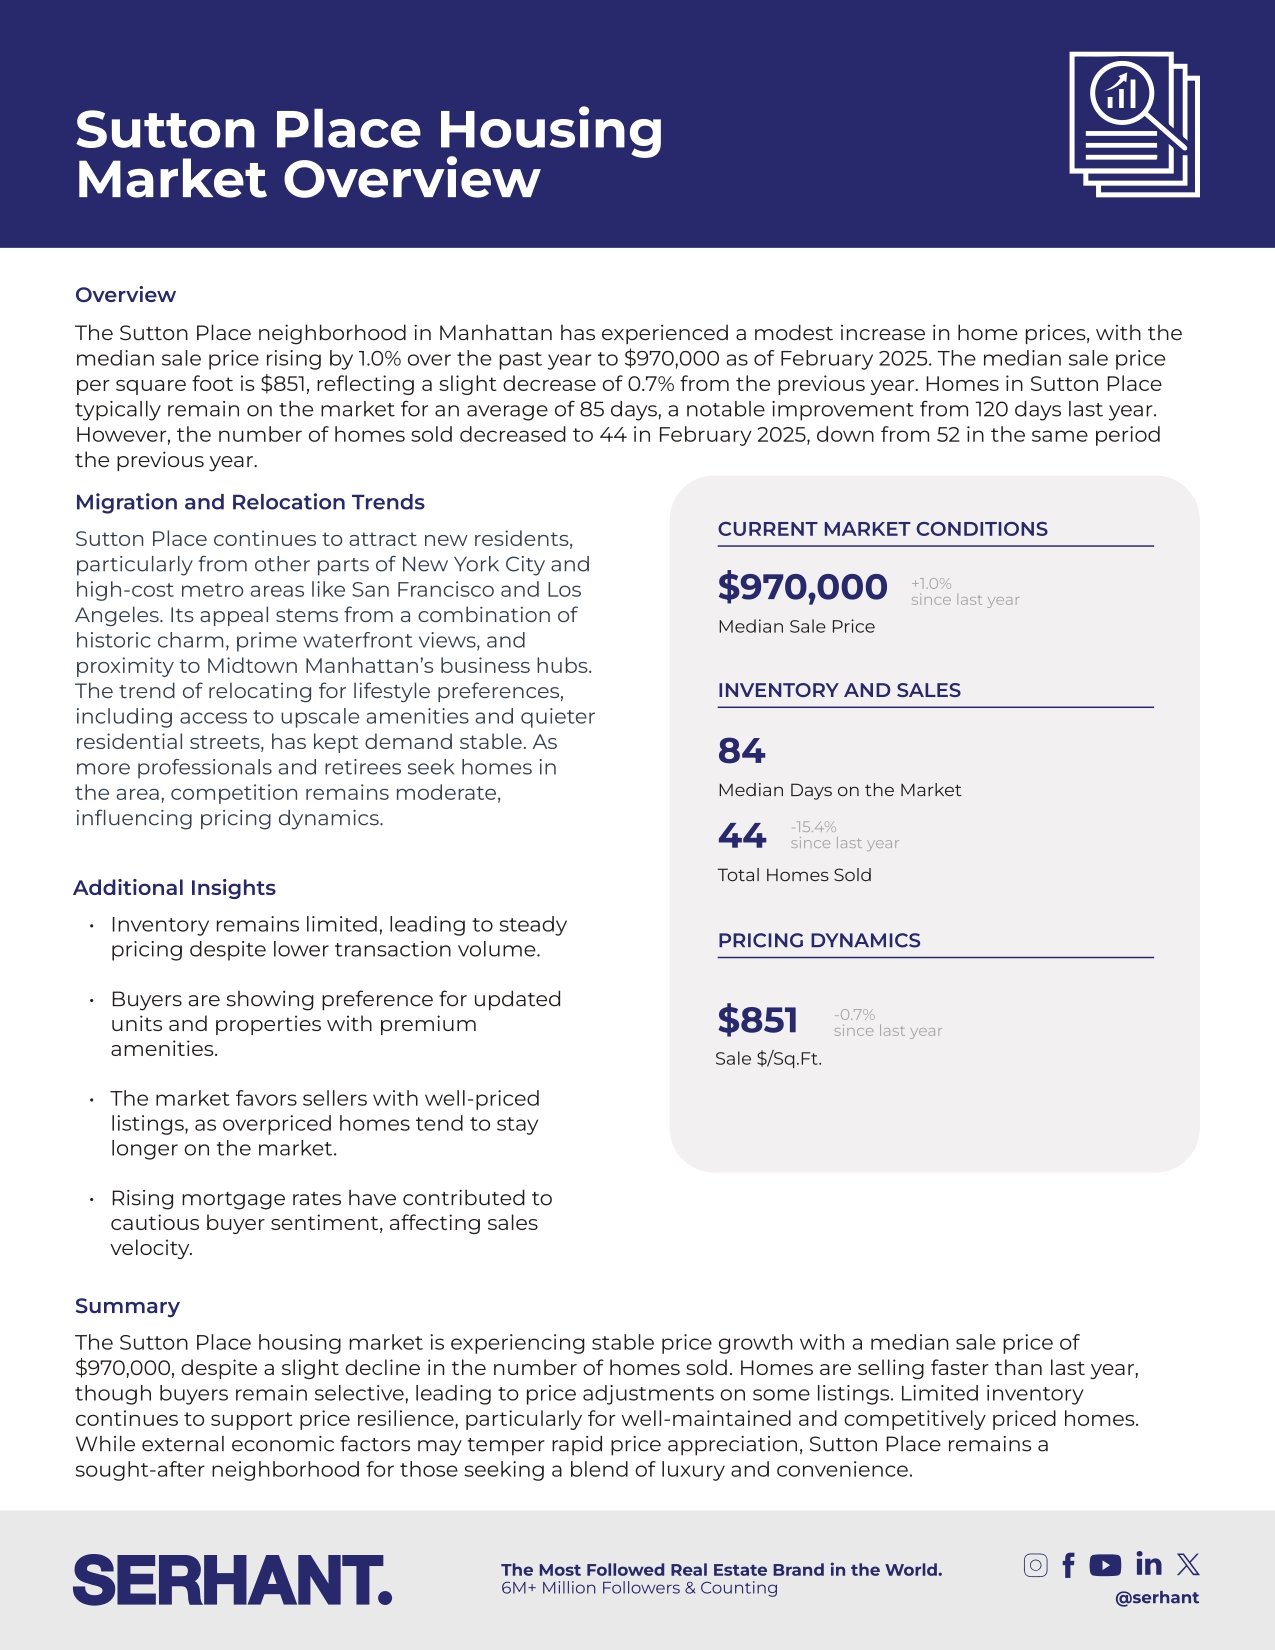
Sutton Place housing market infographic with prices, sales figures, relocation trends, and SERHANT. branding.

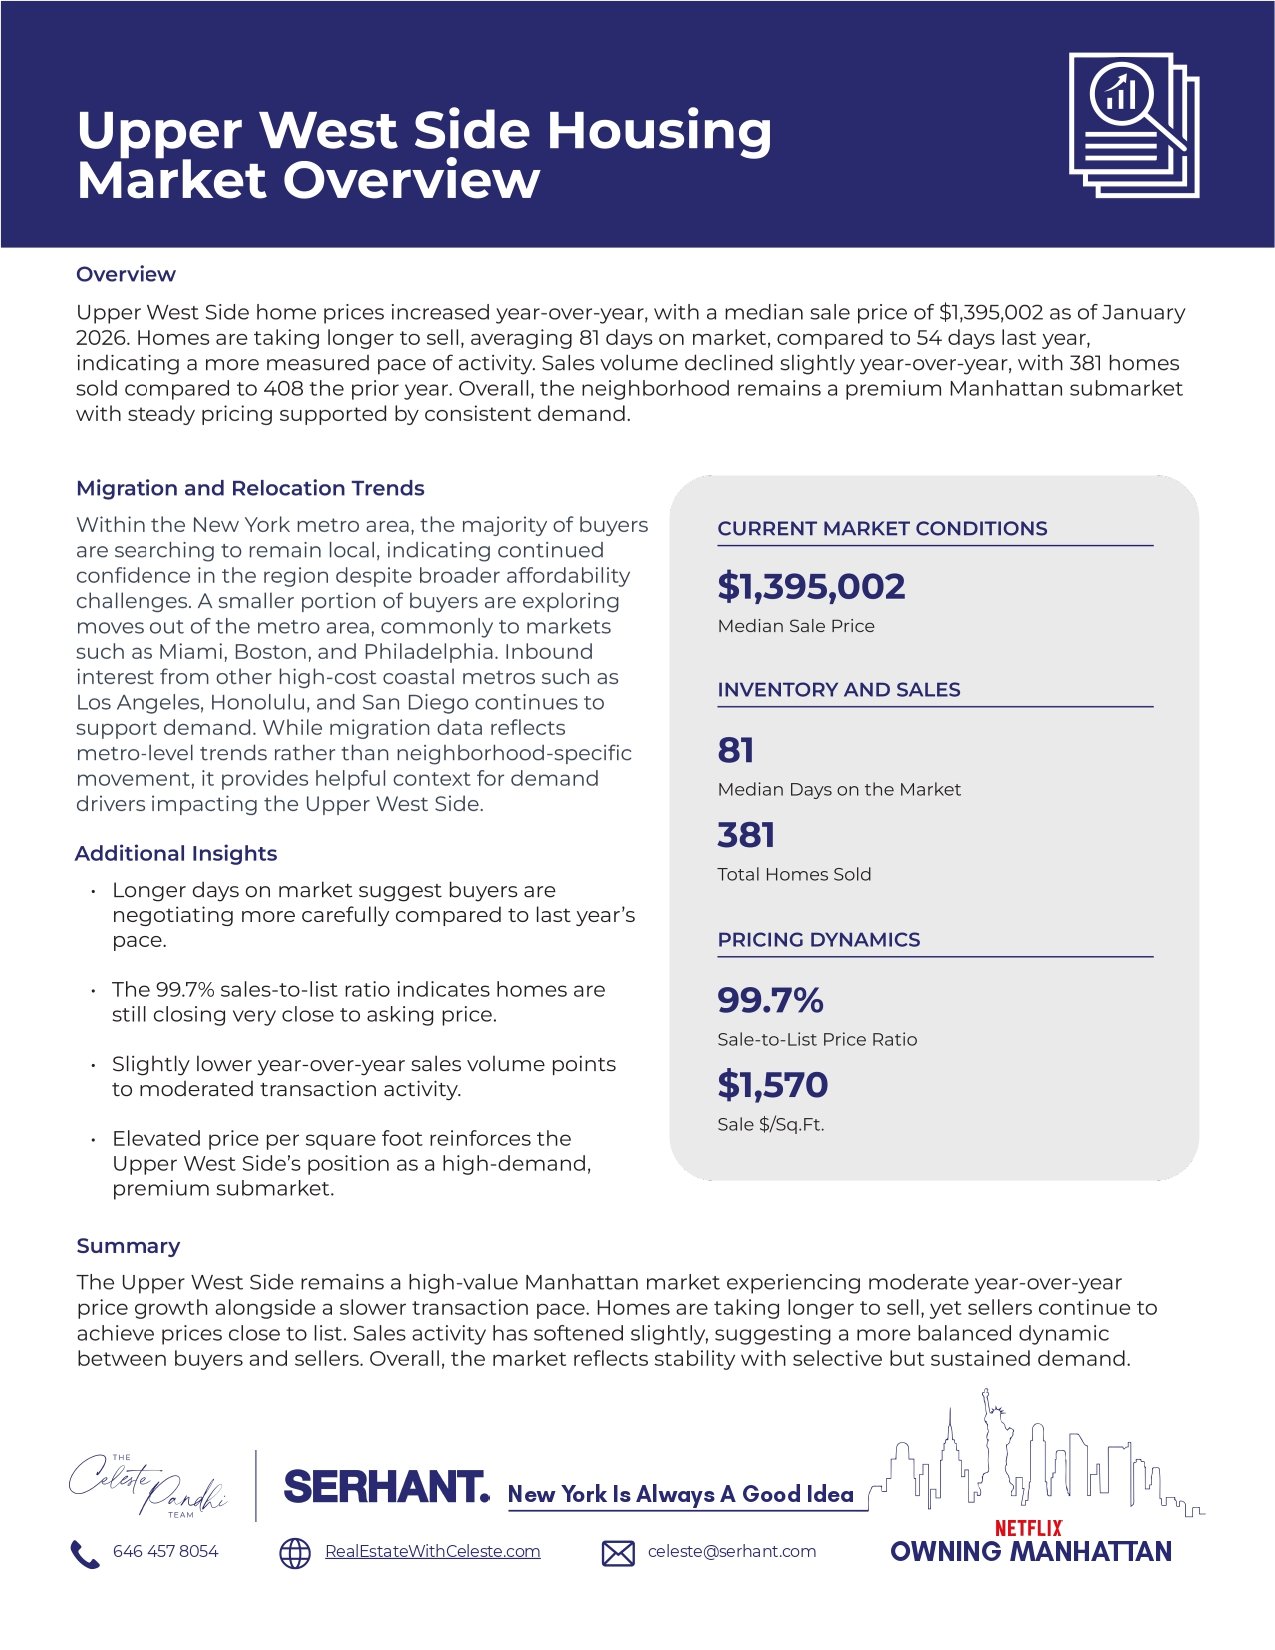
Upper West Side housing market infographic with 2026 pricing, inventory, sales, and migration trends.

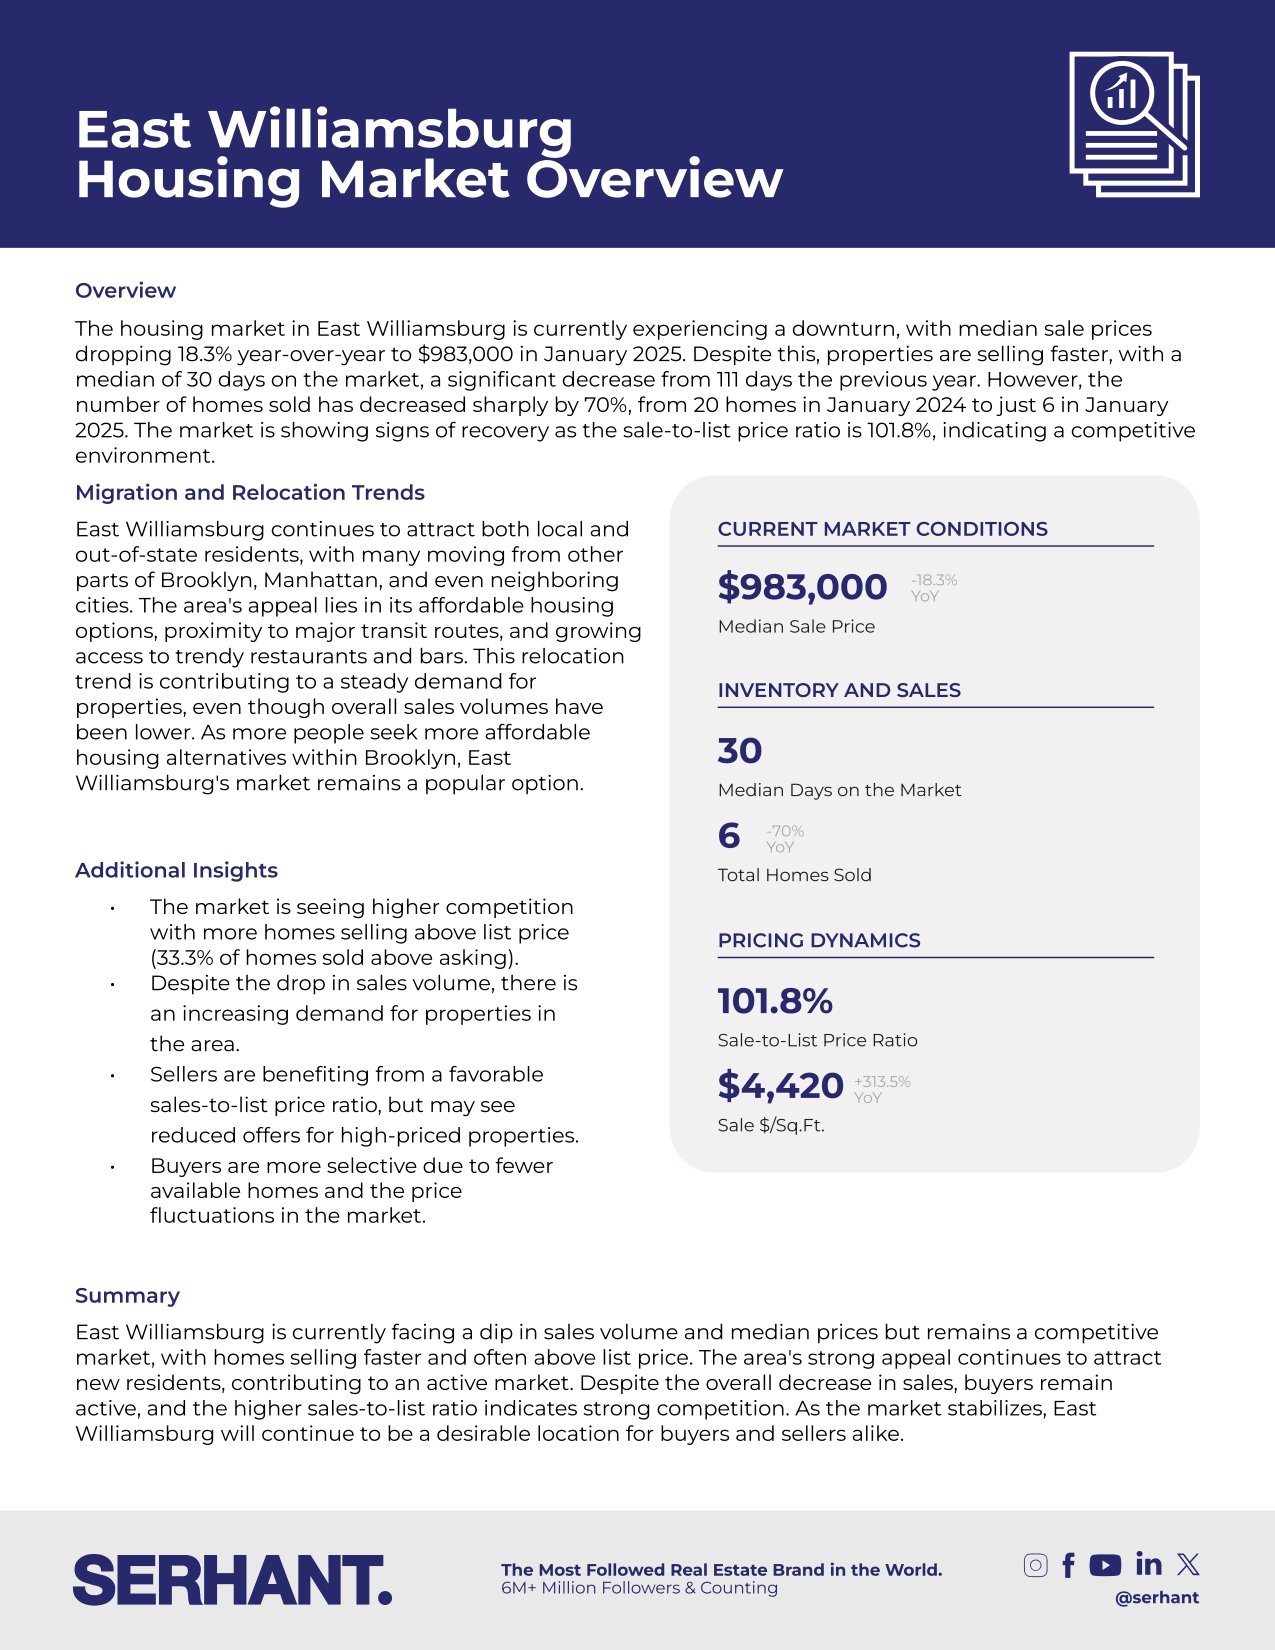
East Williamsburg housing market overview with January 2025 sales, pricing, inventory, and relocation trends.

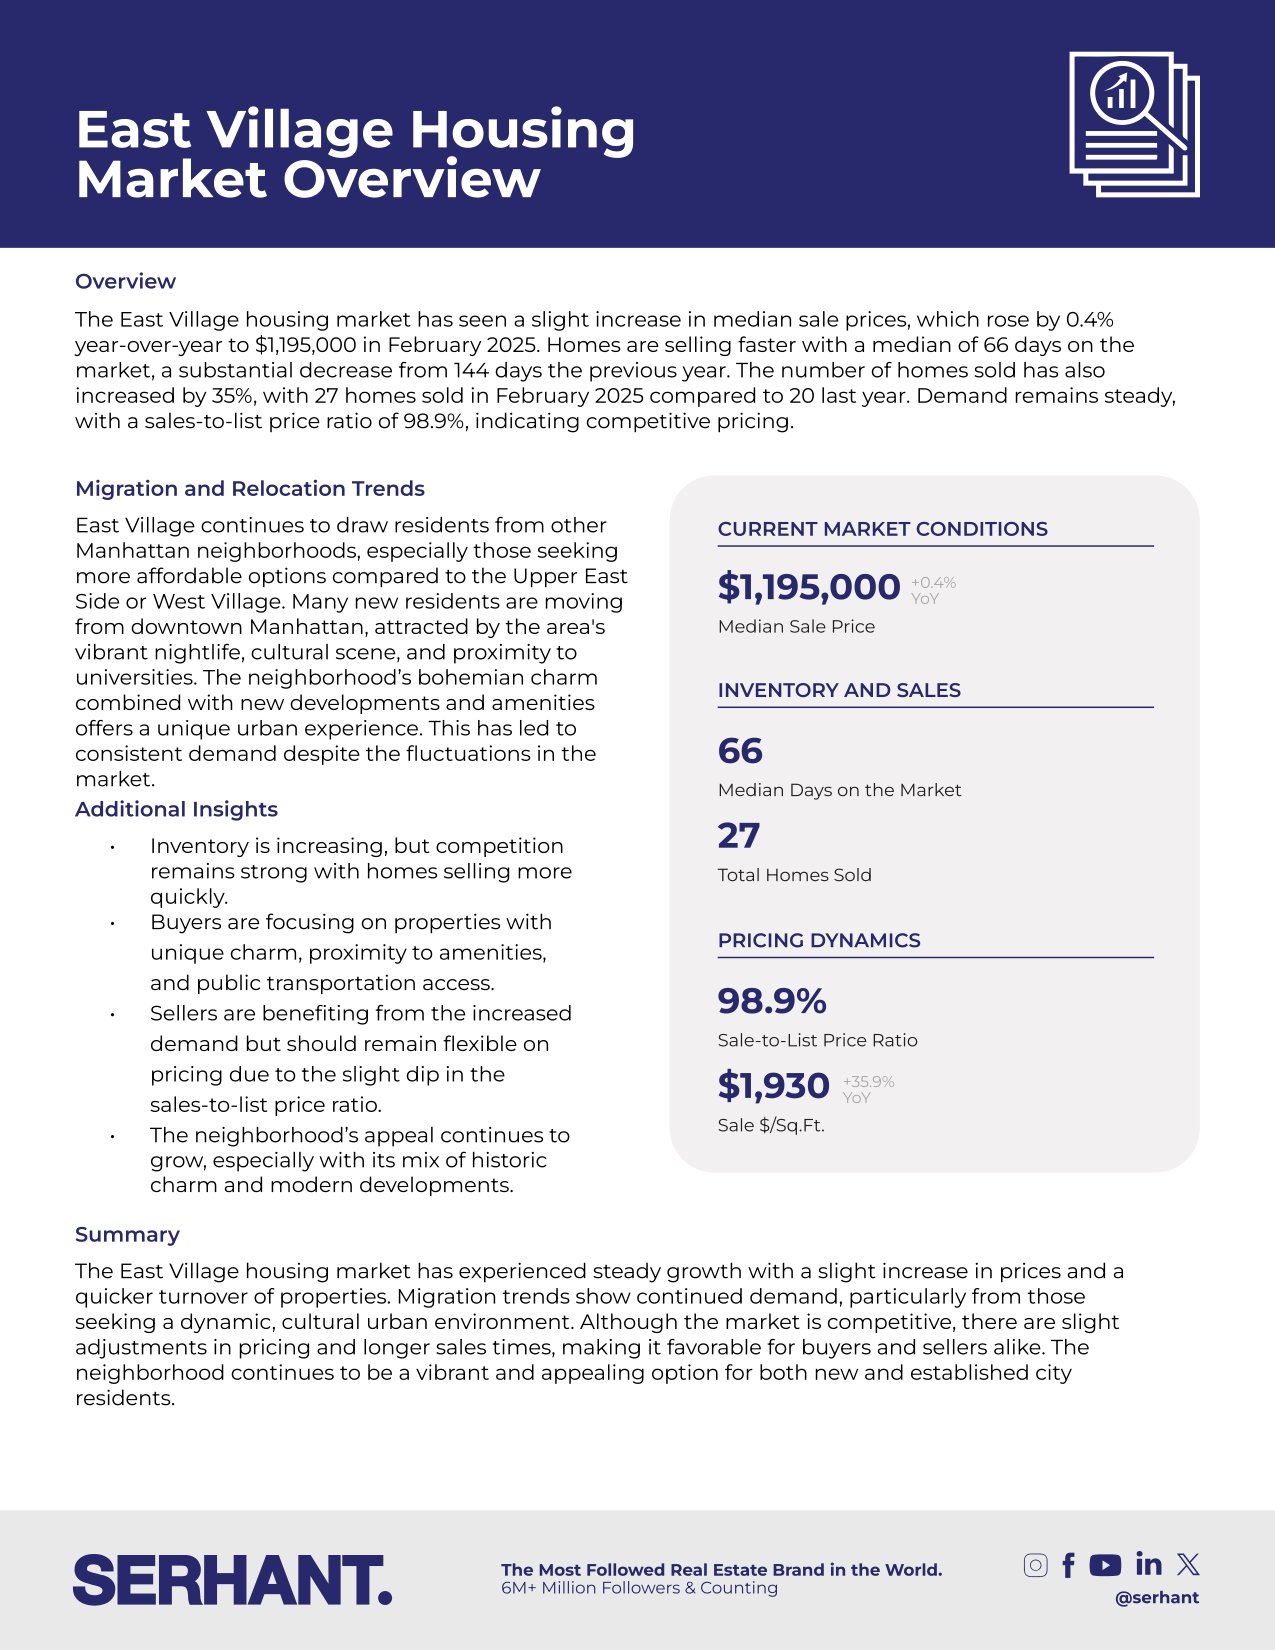
East Village housing market overview infographic with February 2025 prices, sales, inventory, and neighborhood trends.

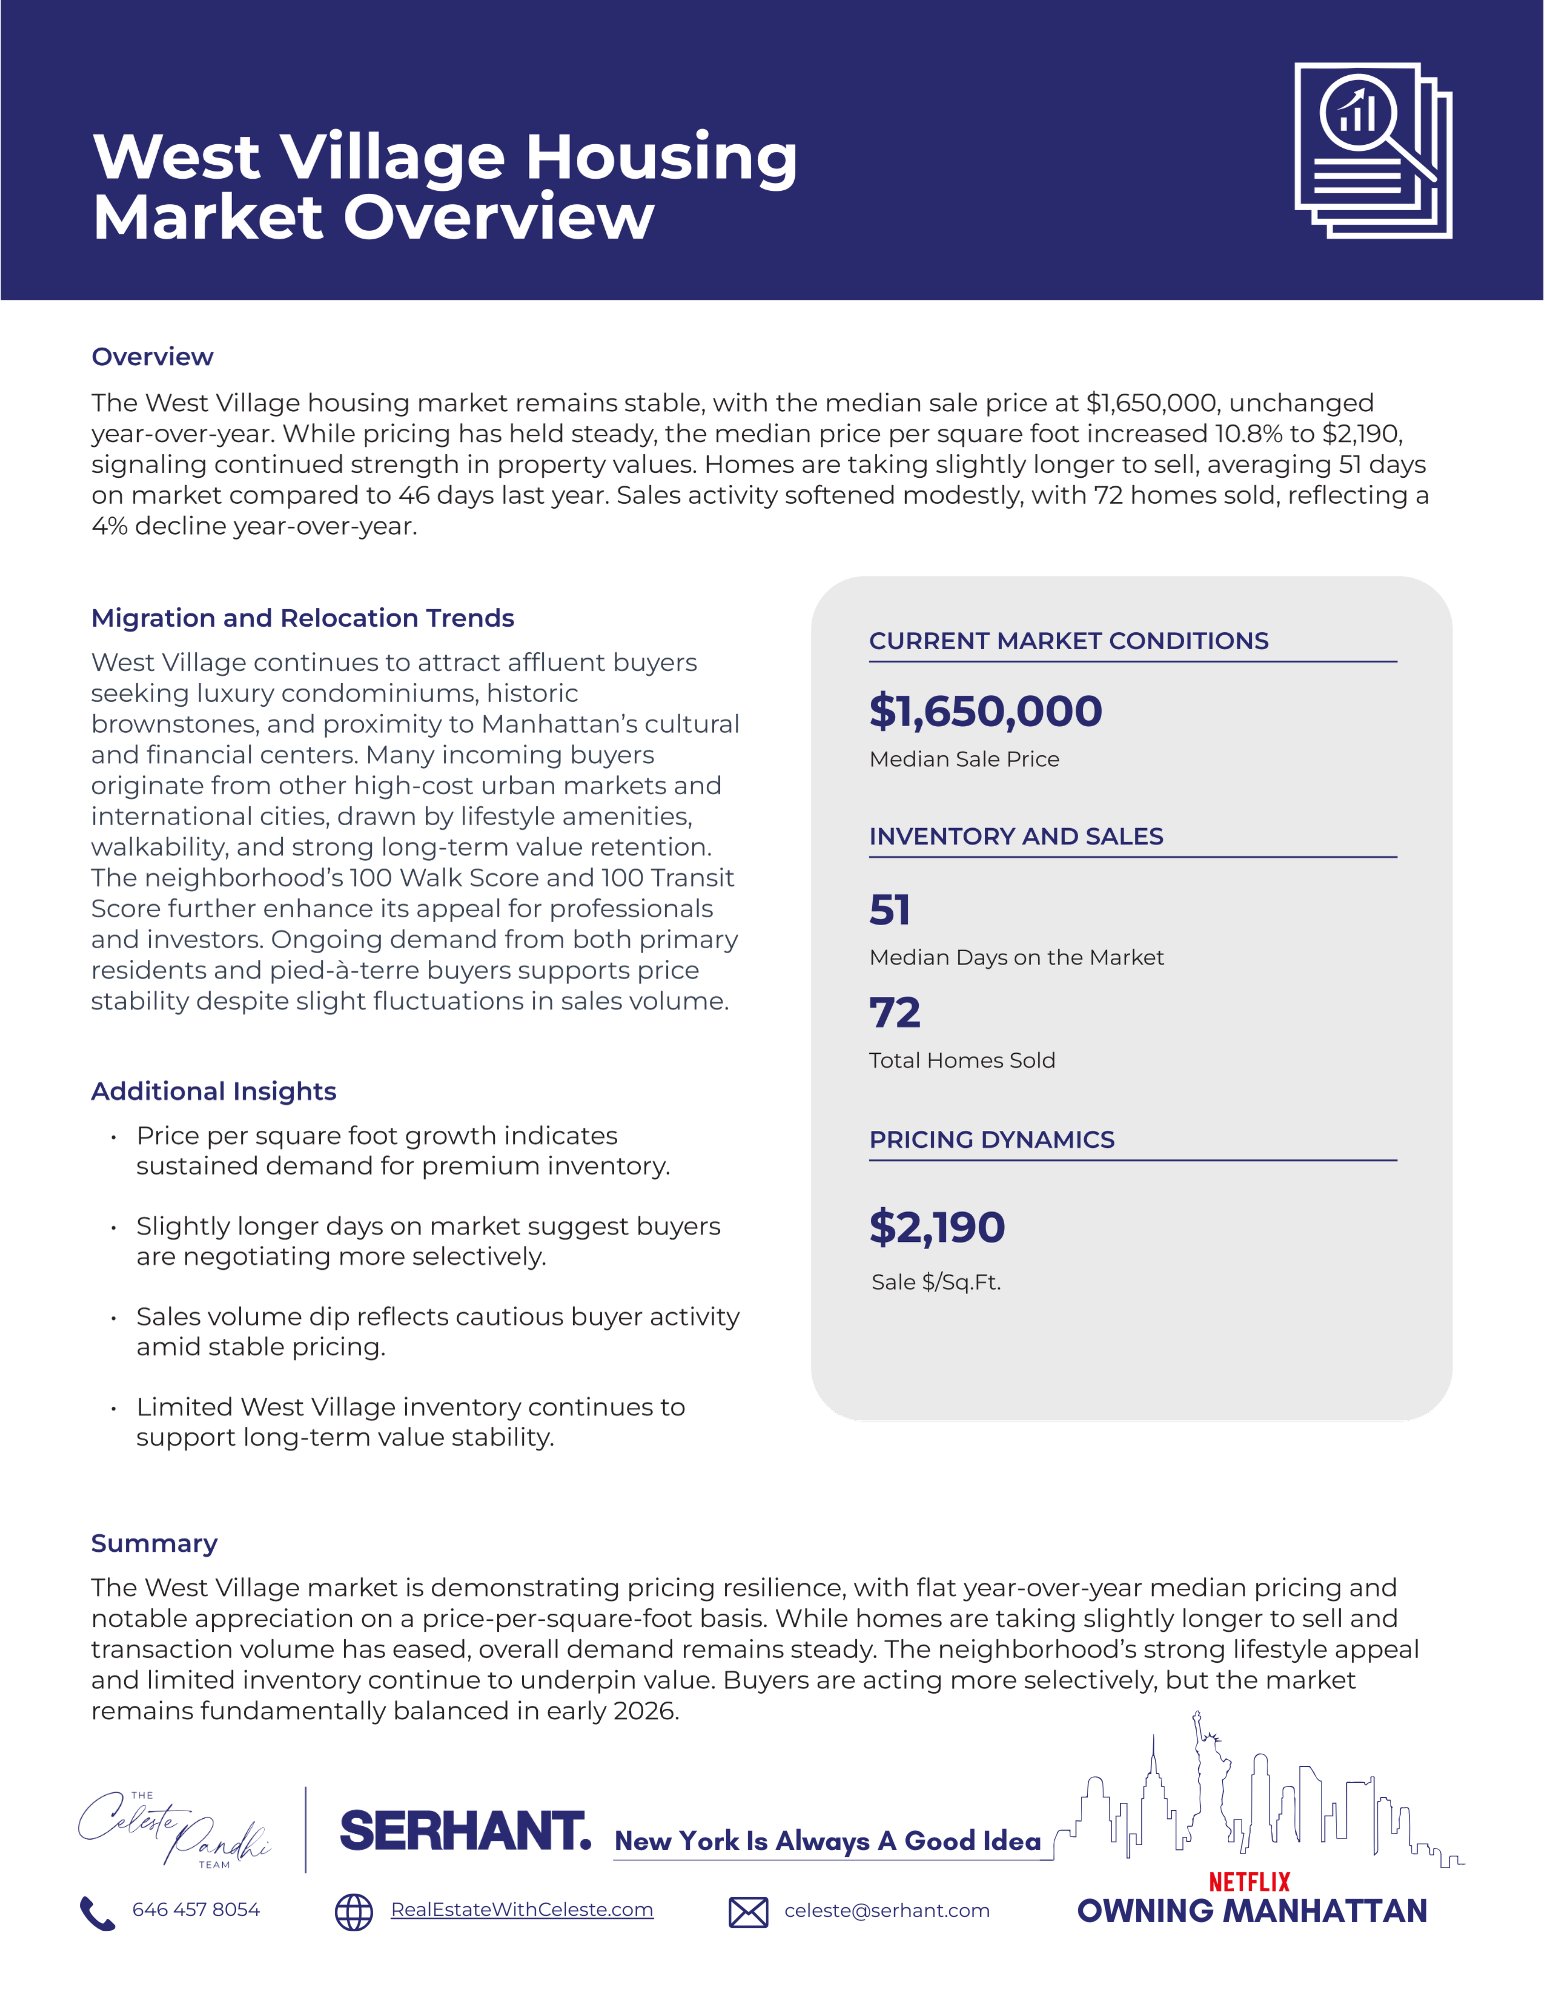
West Village housing market infographic with prices, sales figures, market commentary, and Celeste Pandhi Team branding.

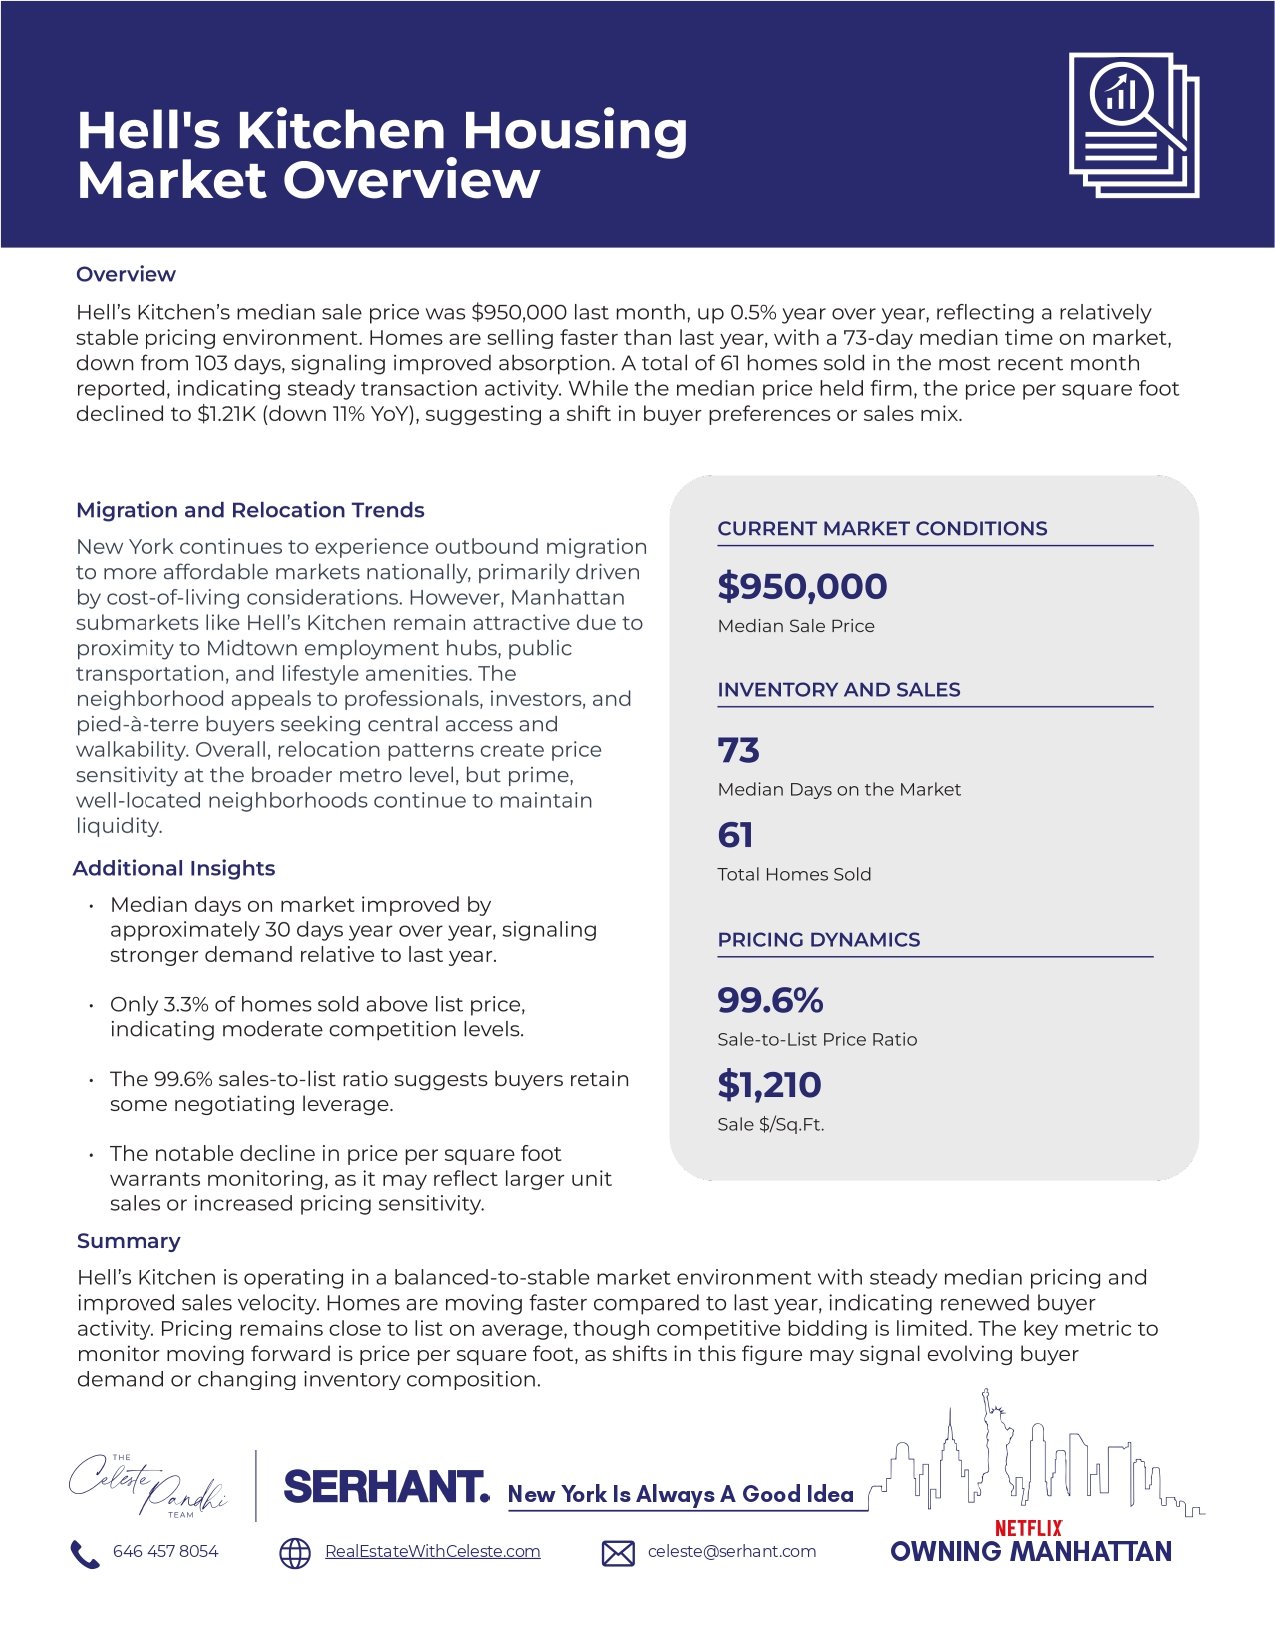
Hell’s Kitchen housing market infographic with sale prices, inventory figures, and market trends.

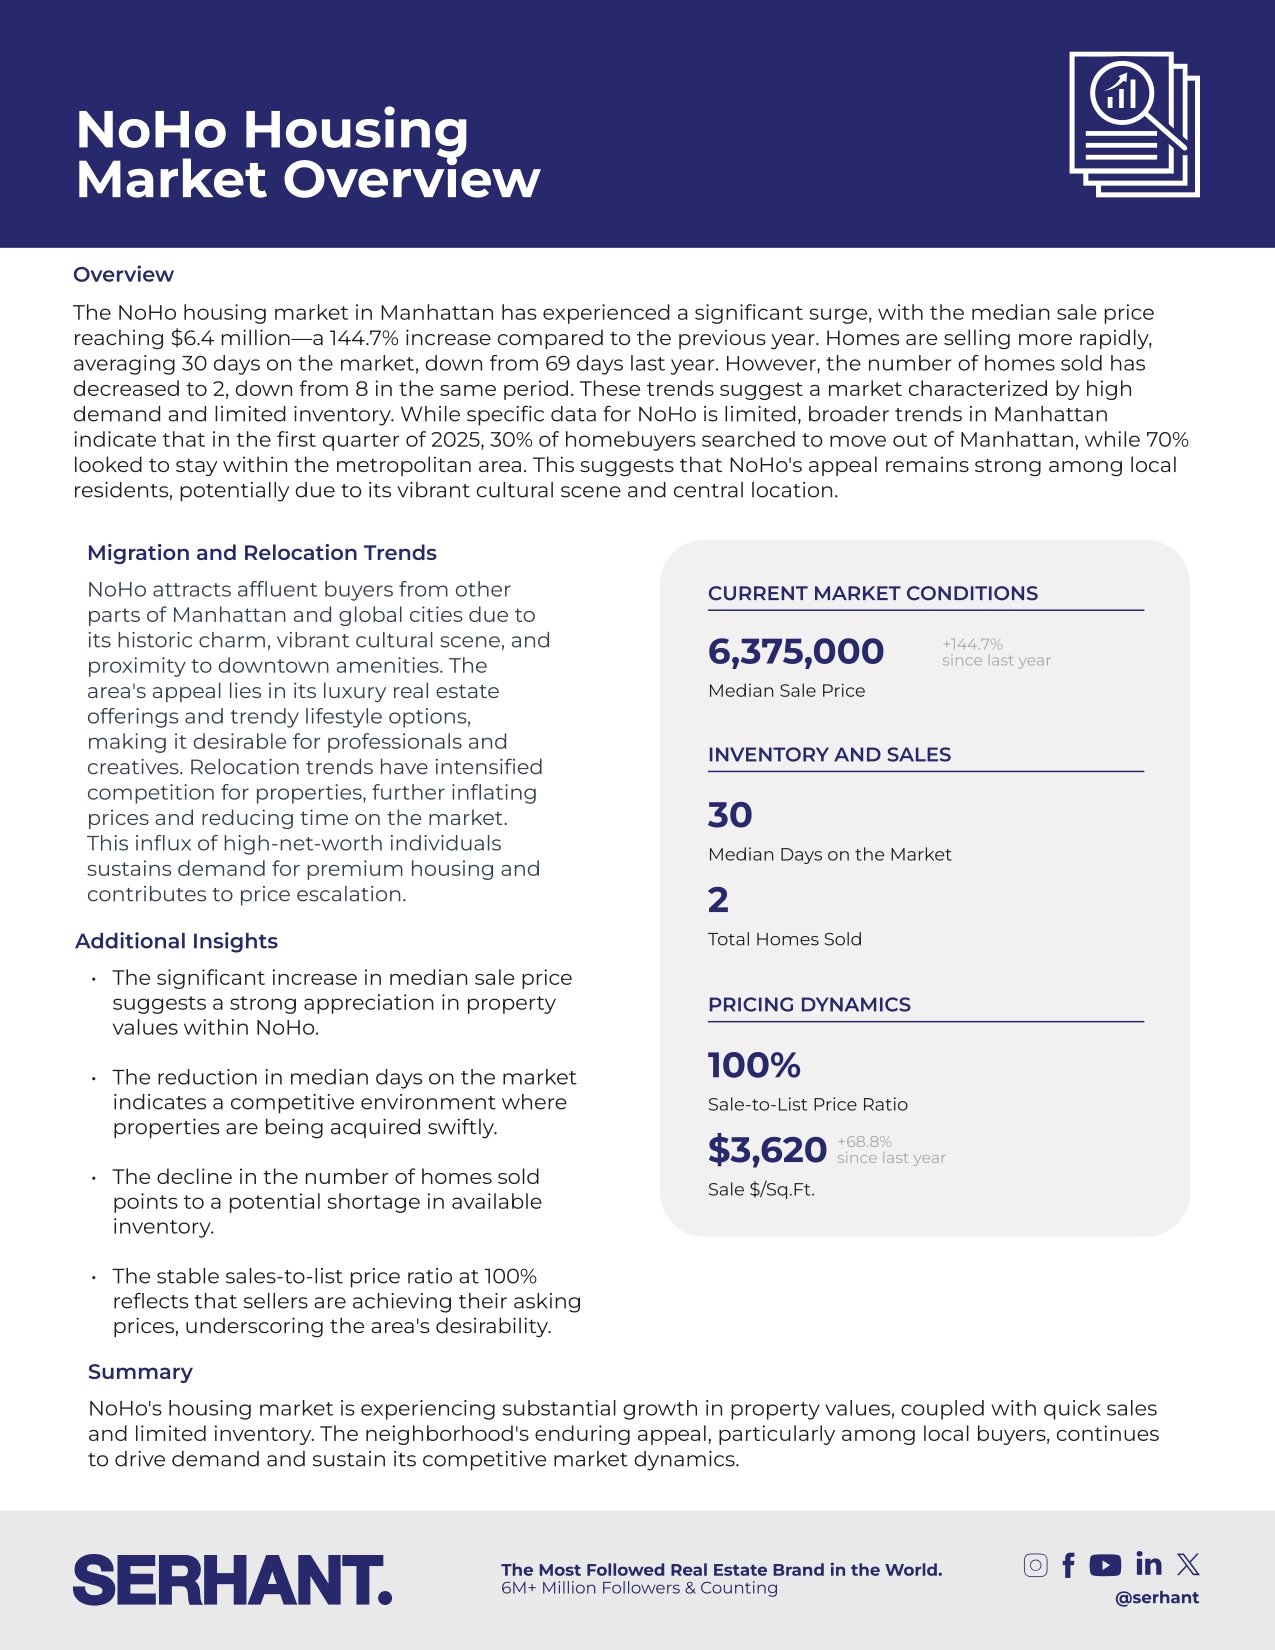
NoHo housing market overview infographic with median prices, inventory, sales, and pricing trends.

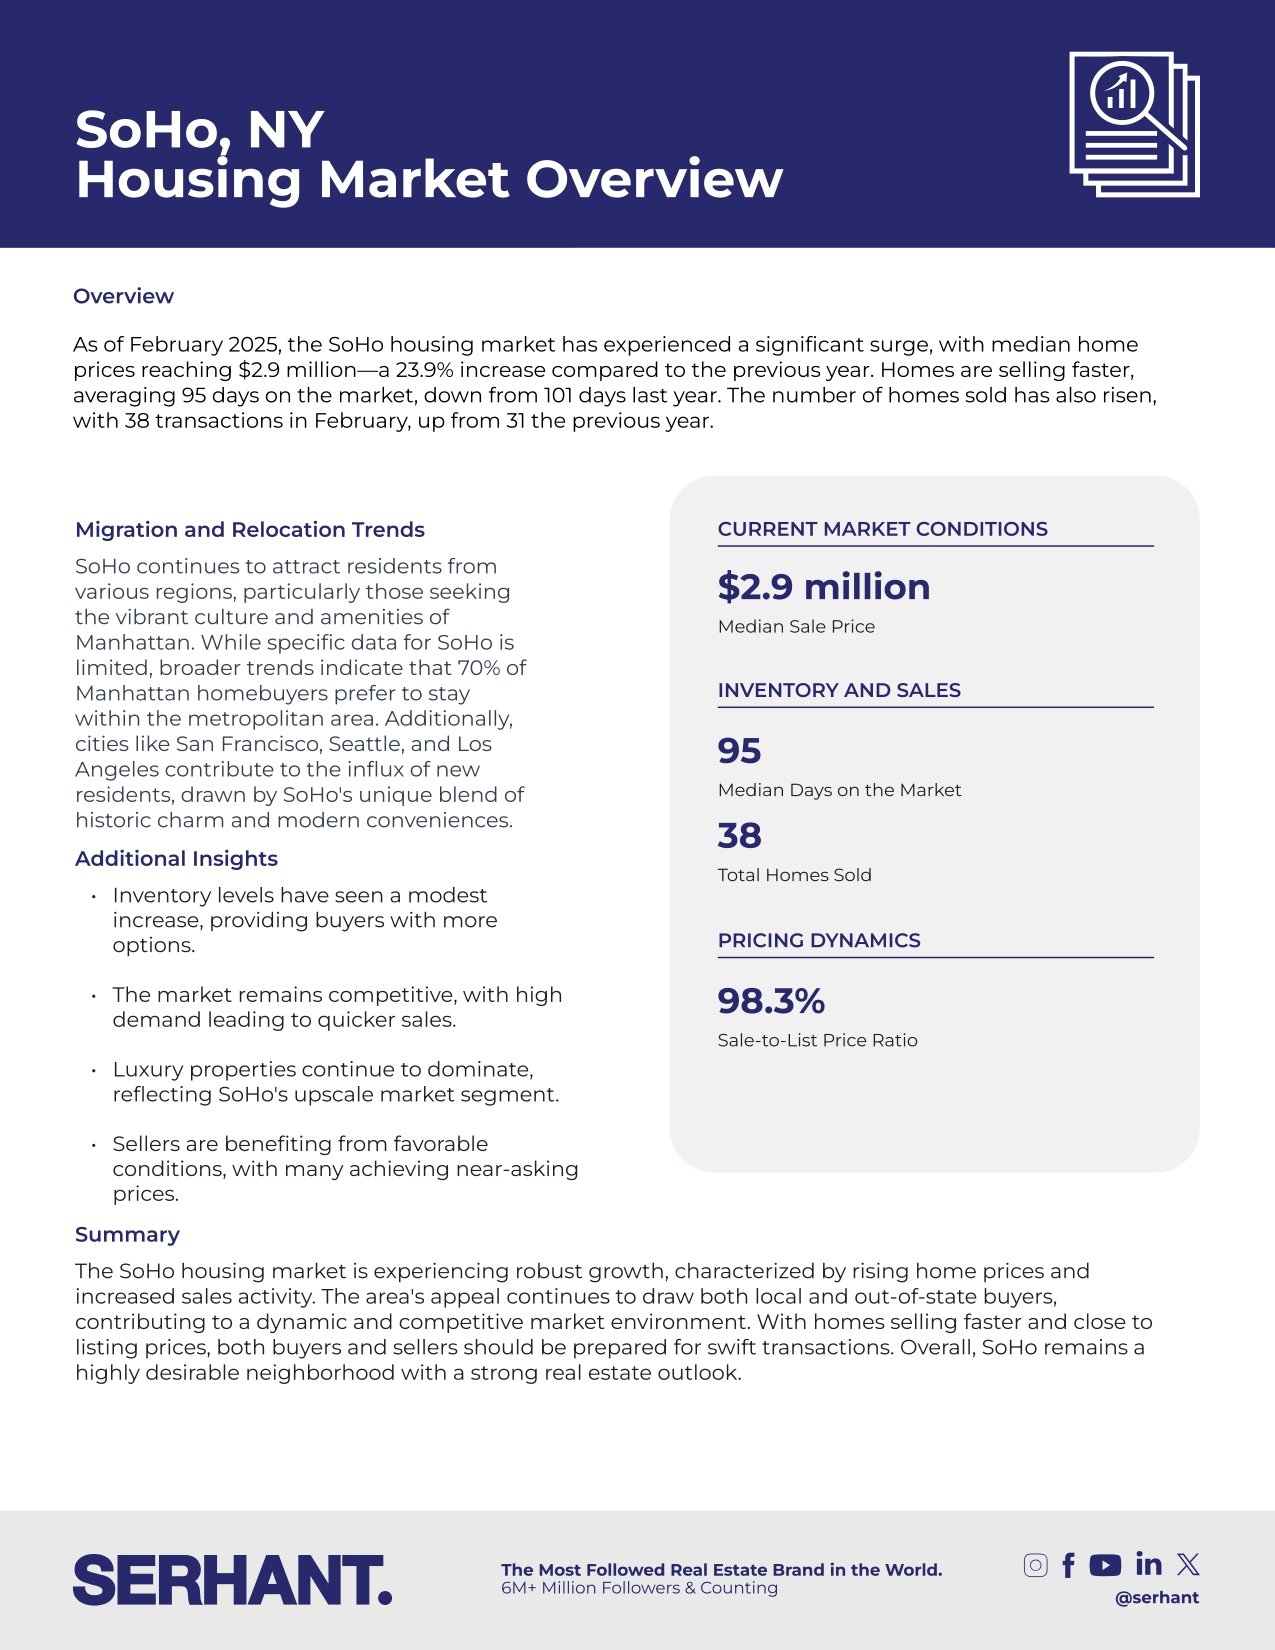
SoHo housing market infographic with February 2025 prices, sales, days on market, trends, and SERHANT. branding.

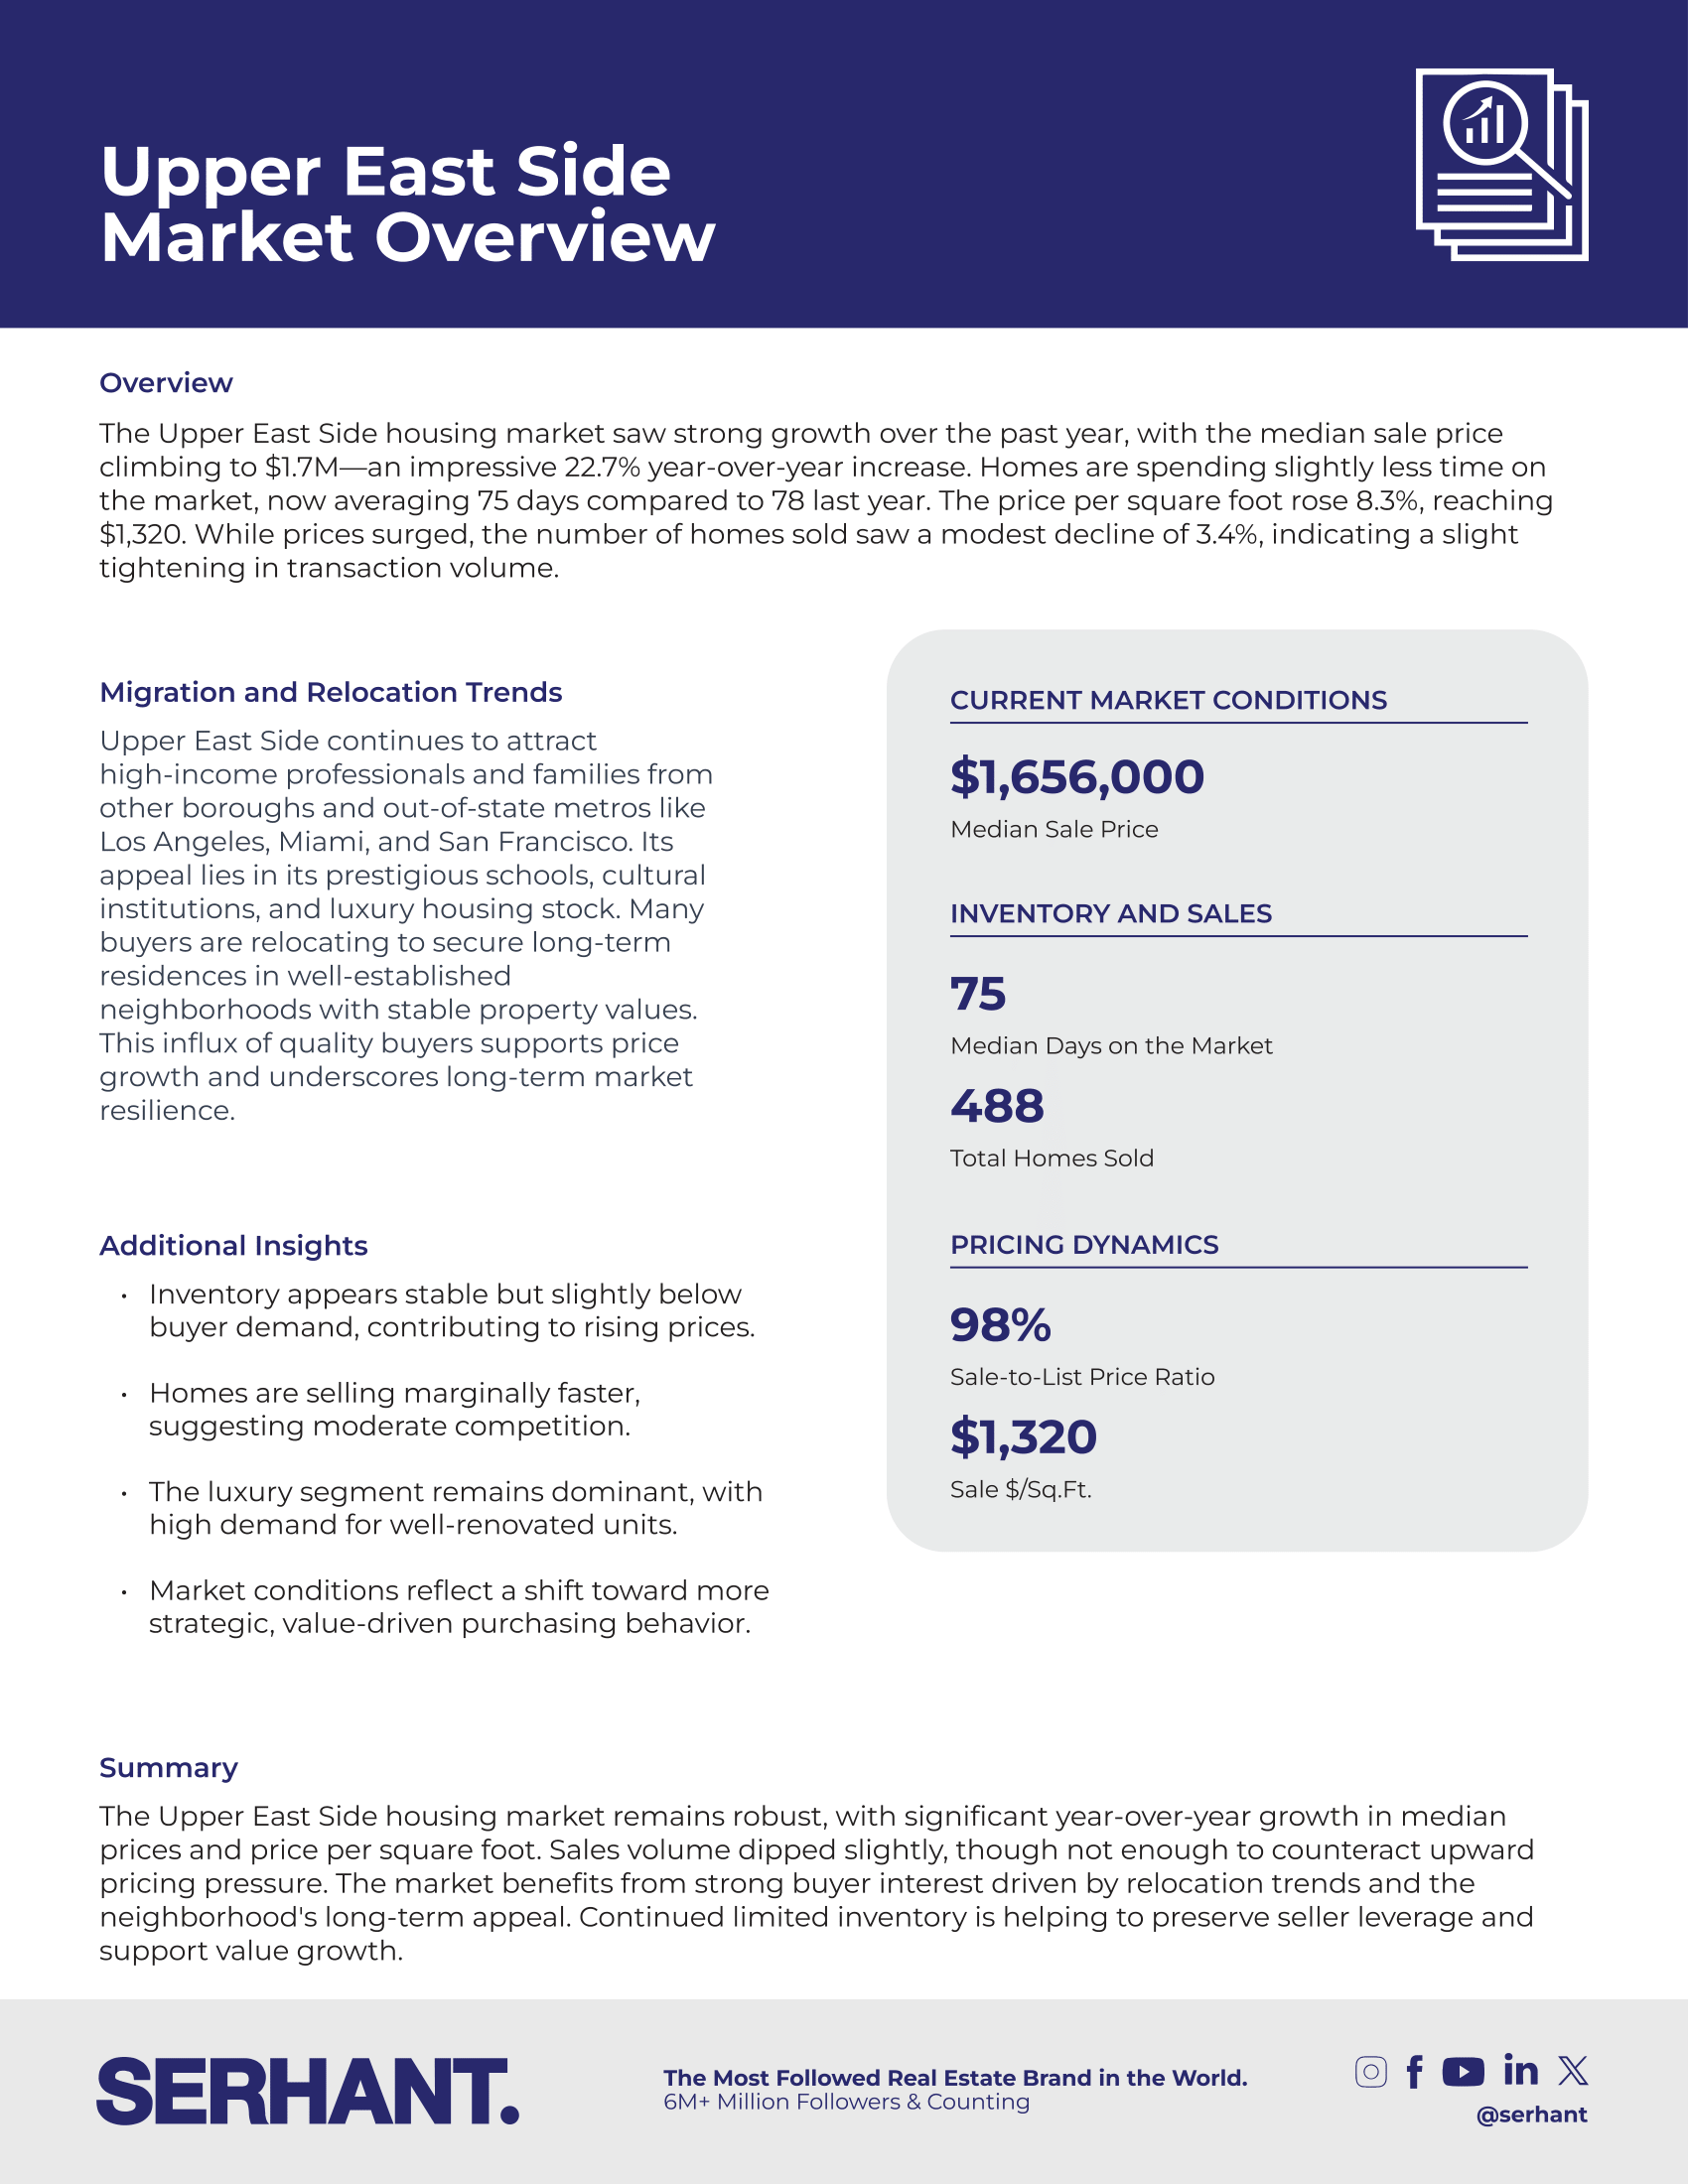
Upper East Side housing market infographic with prices, sales statistics, relocation trends, and a SERHANT. footer.

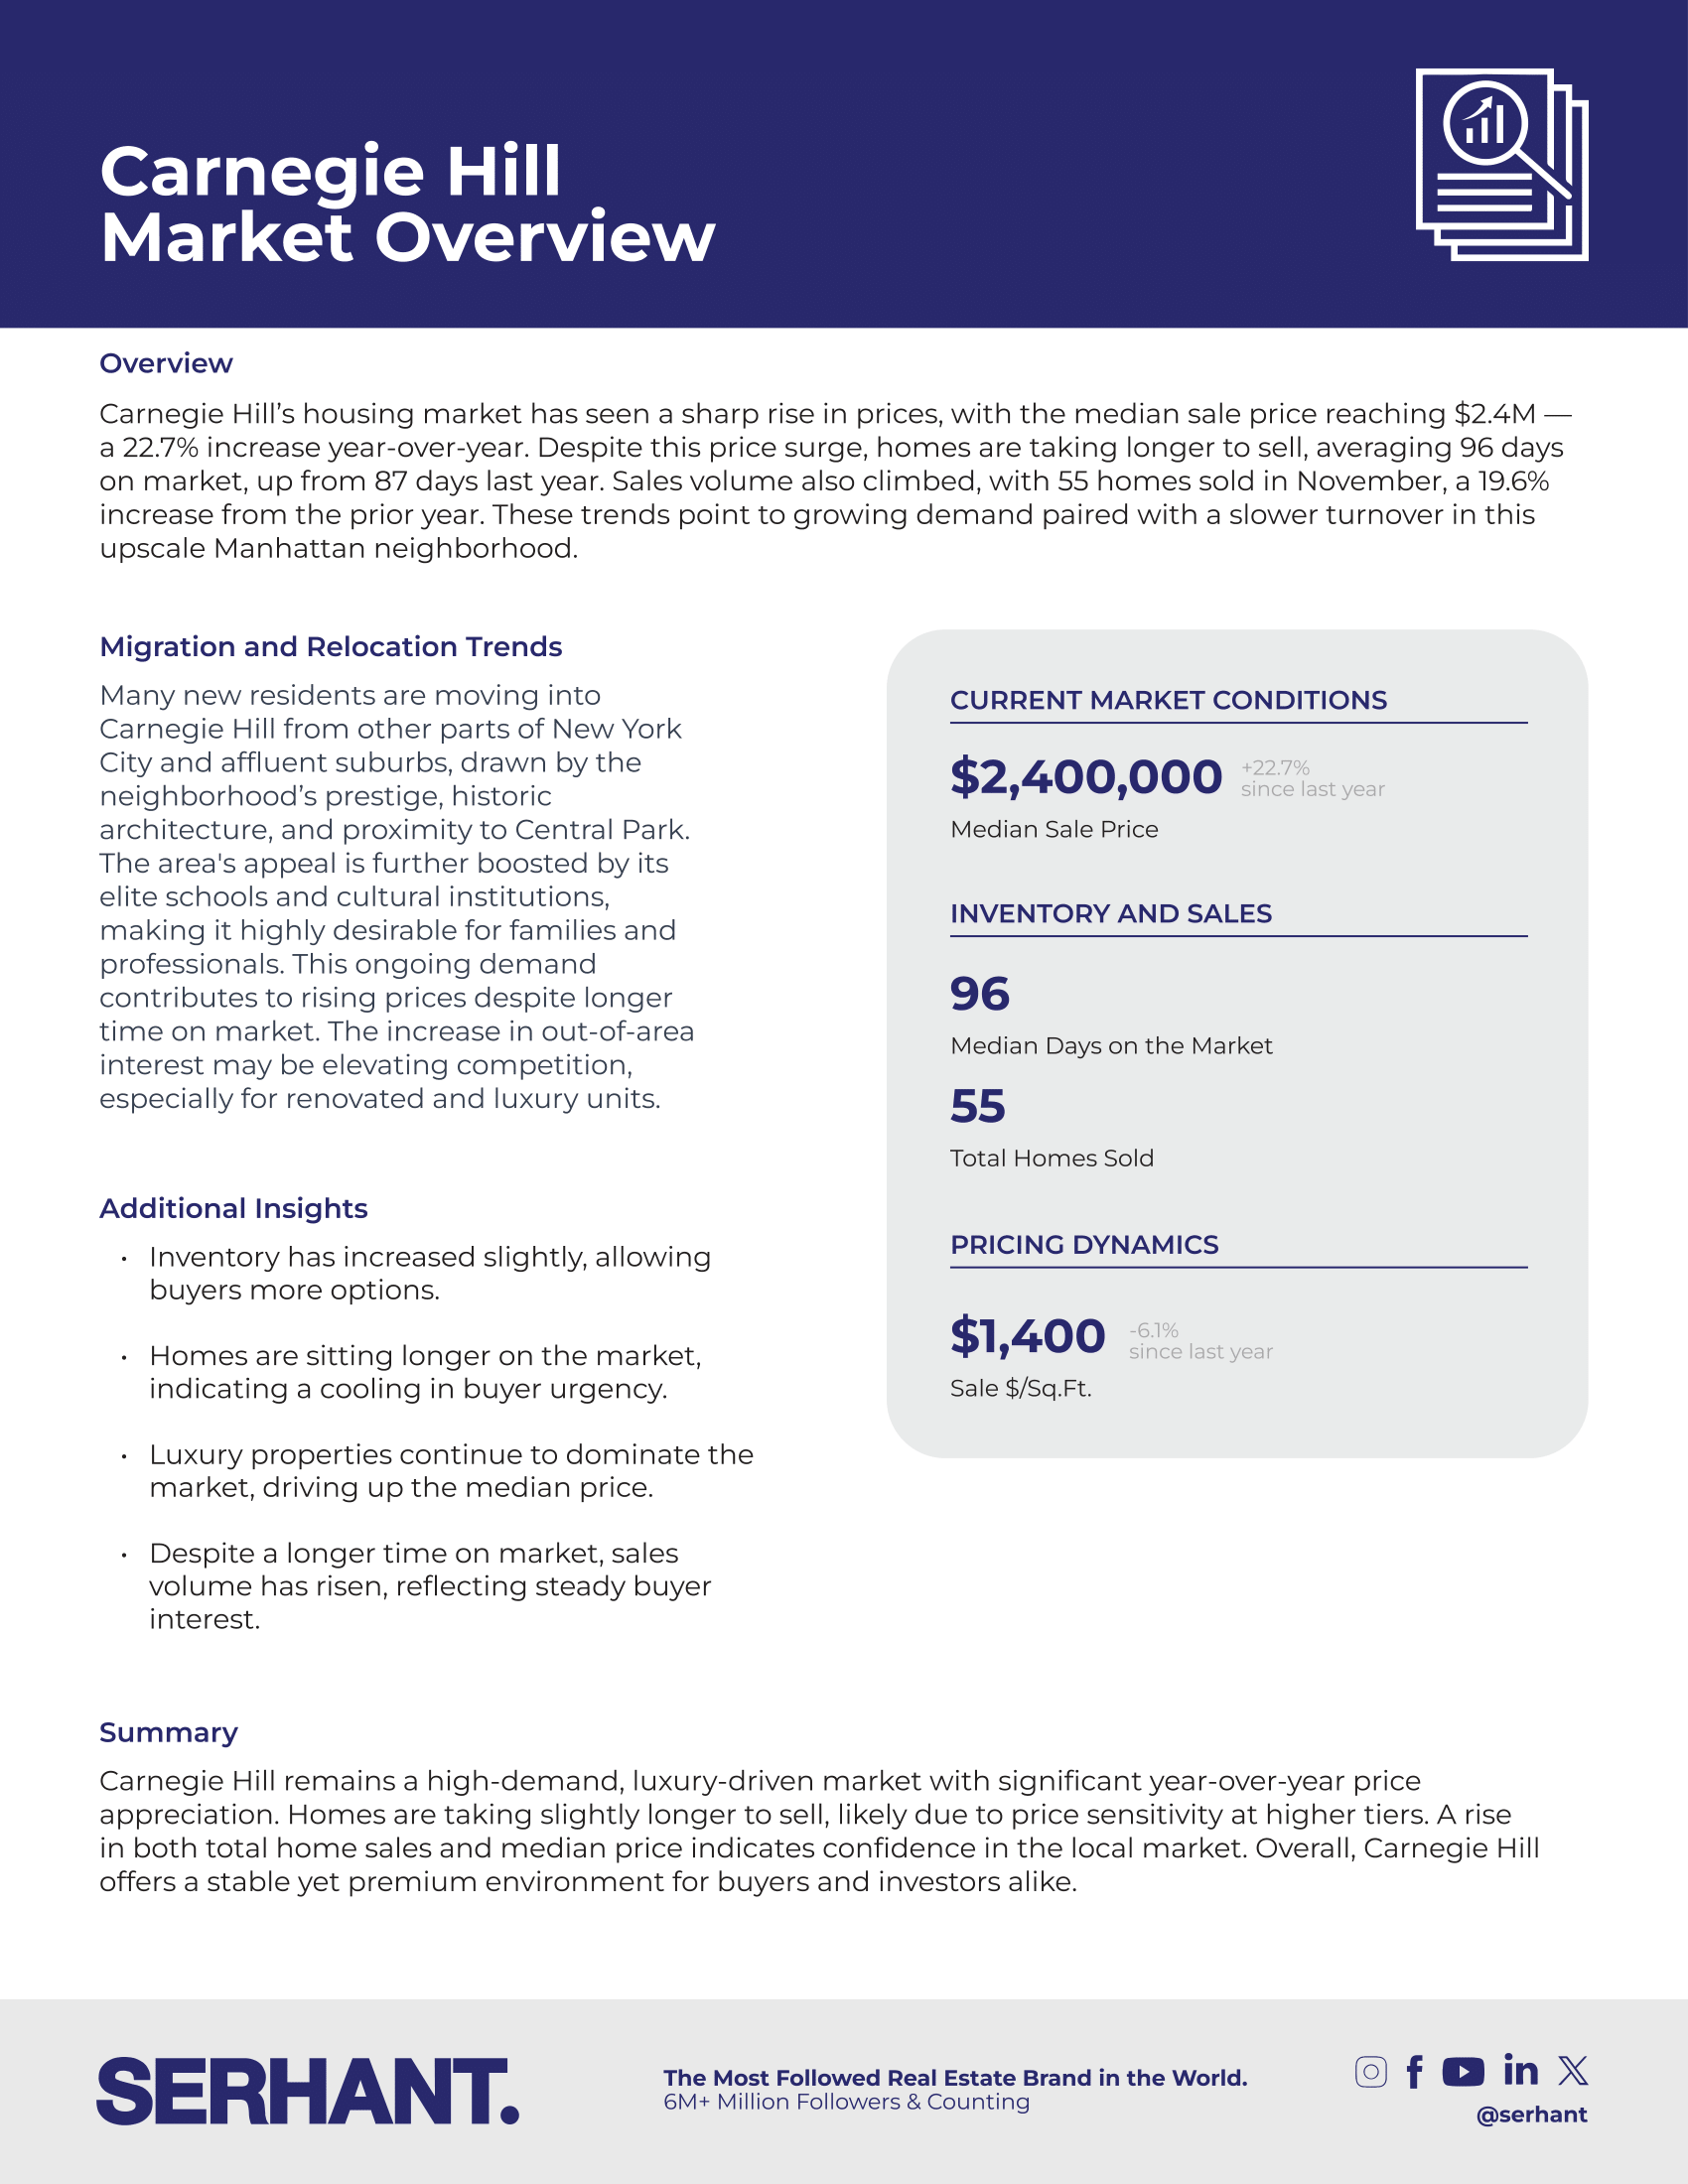
Carnegie Hill market overview infographic with housing prices, sales, days on market, and neighborhood trend summaries.

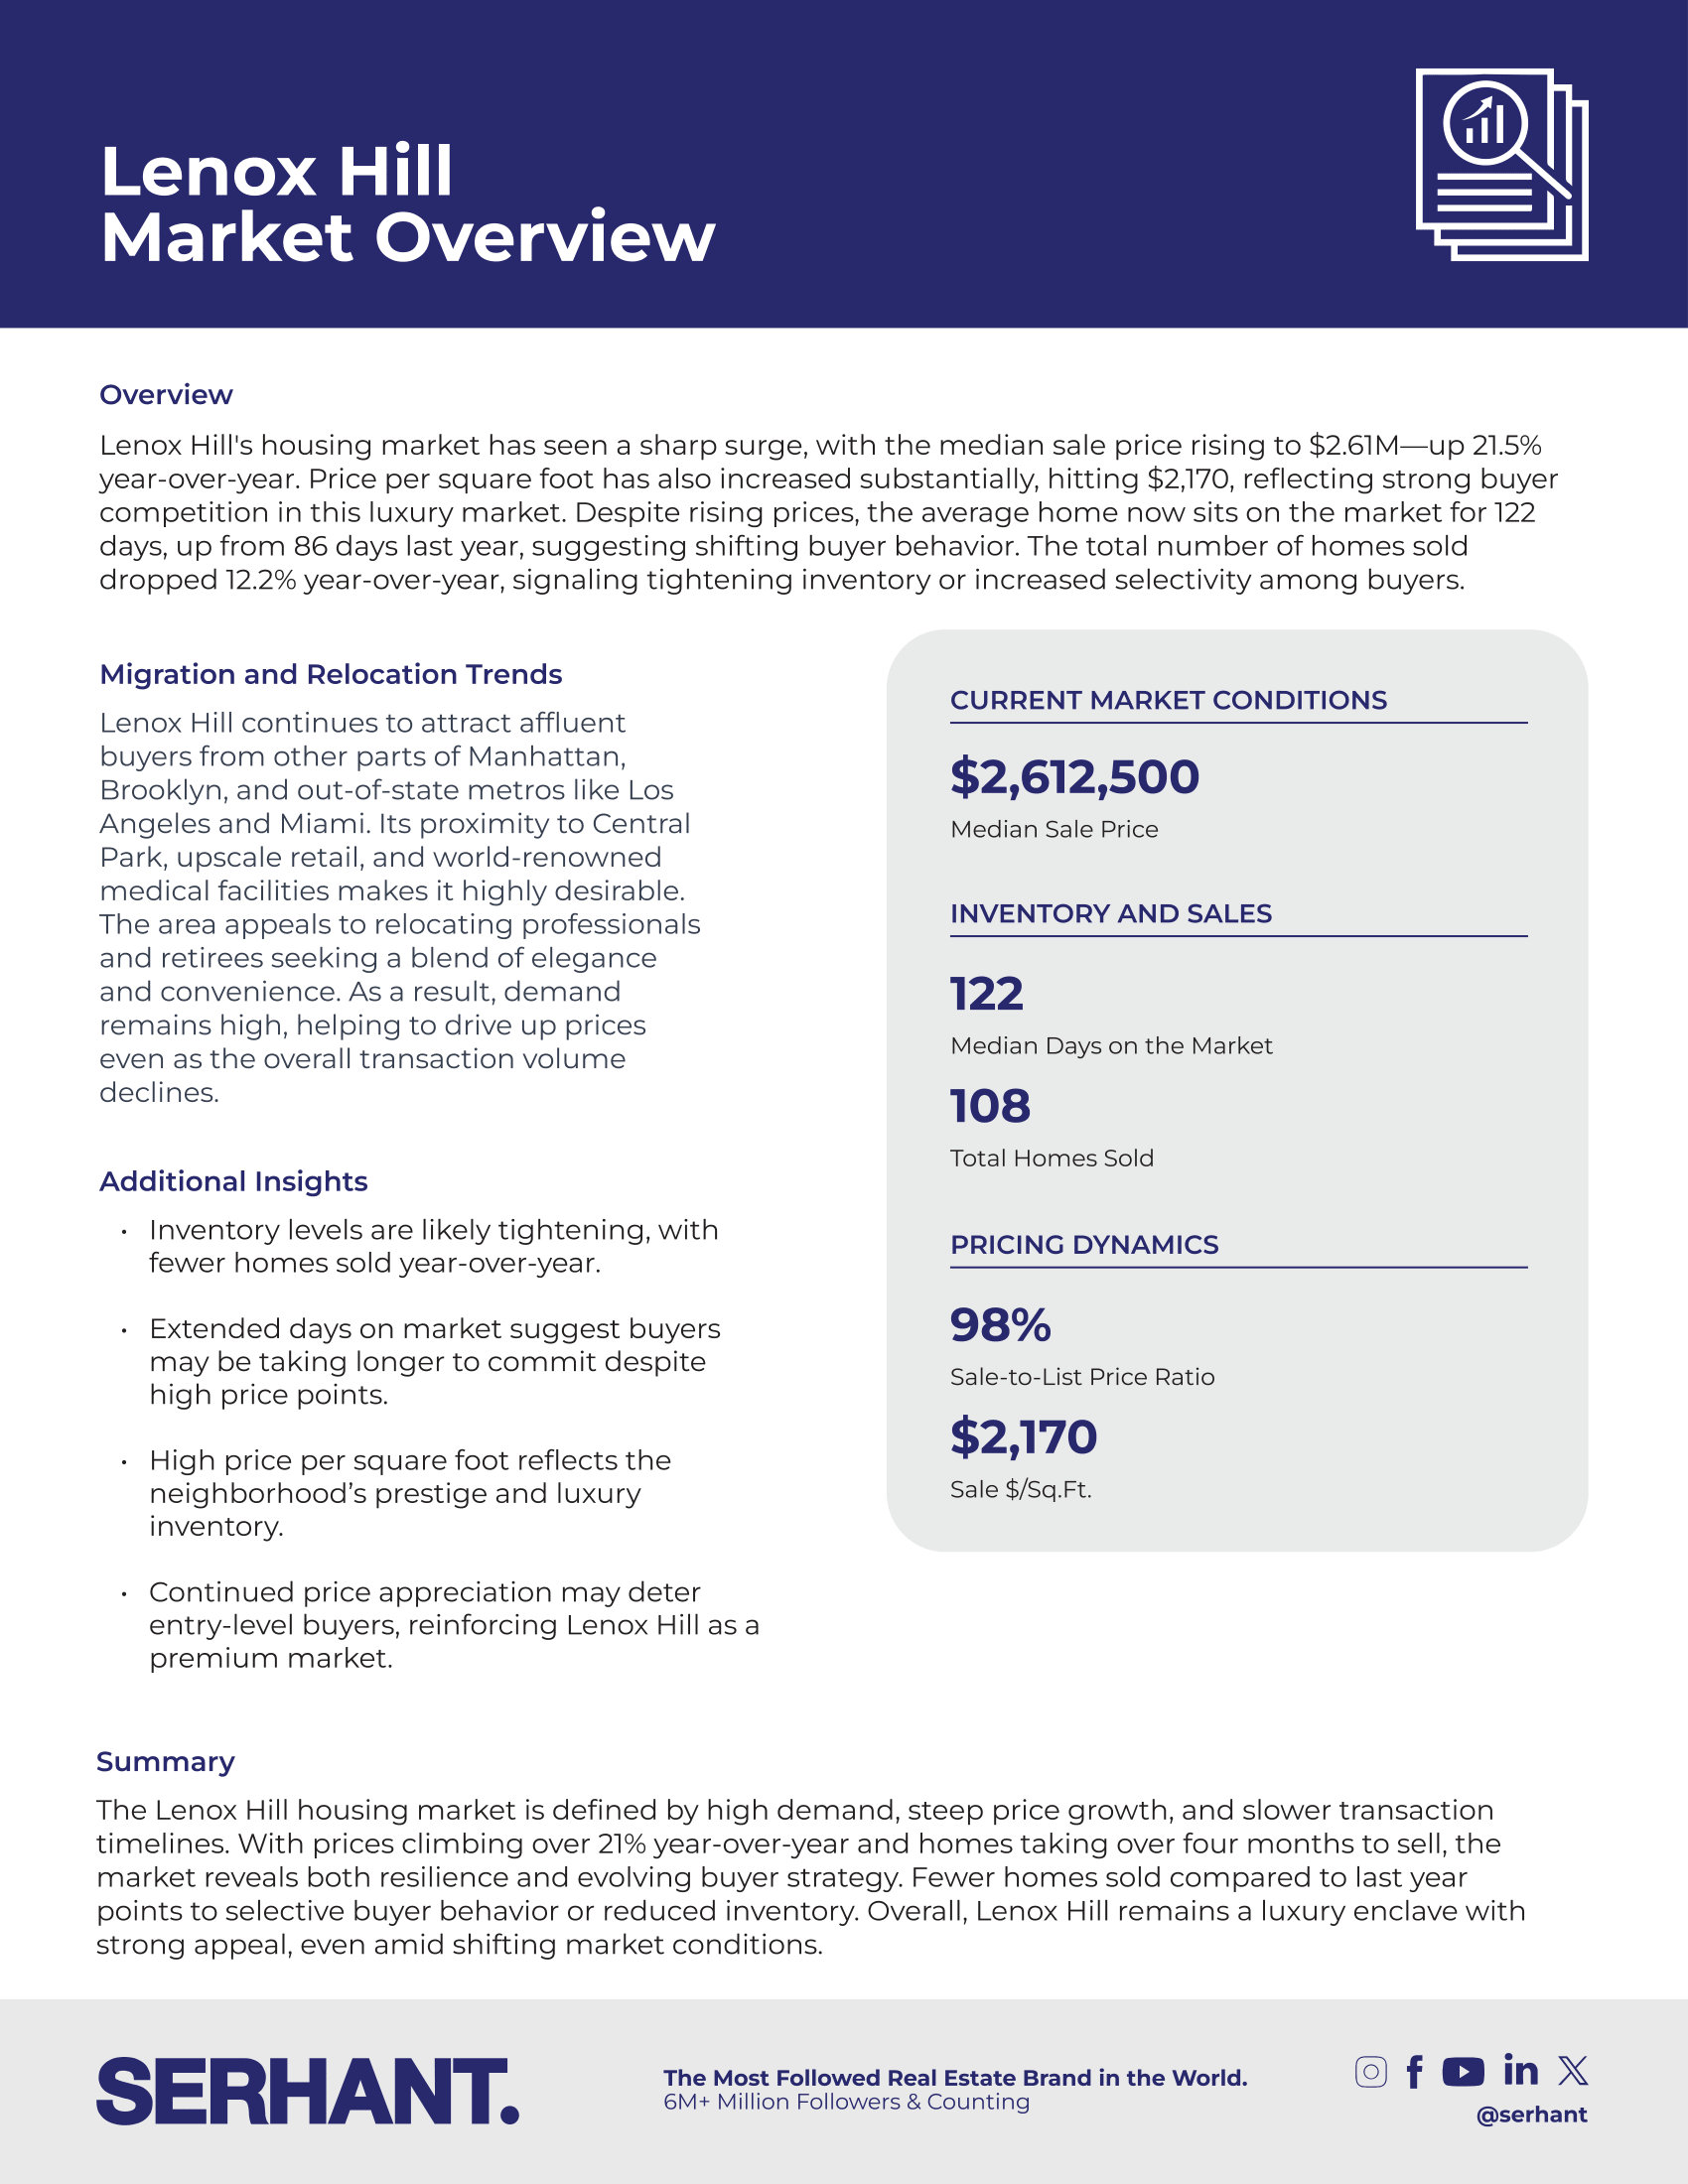
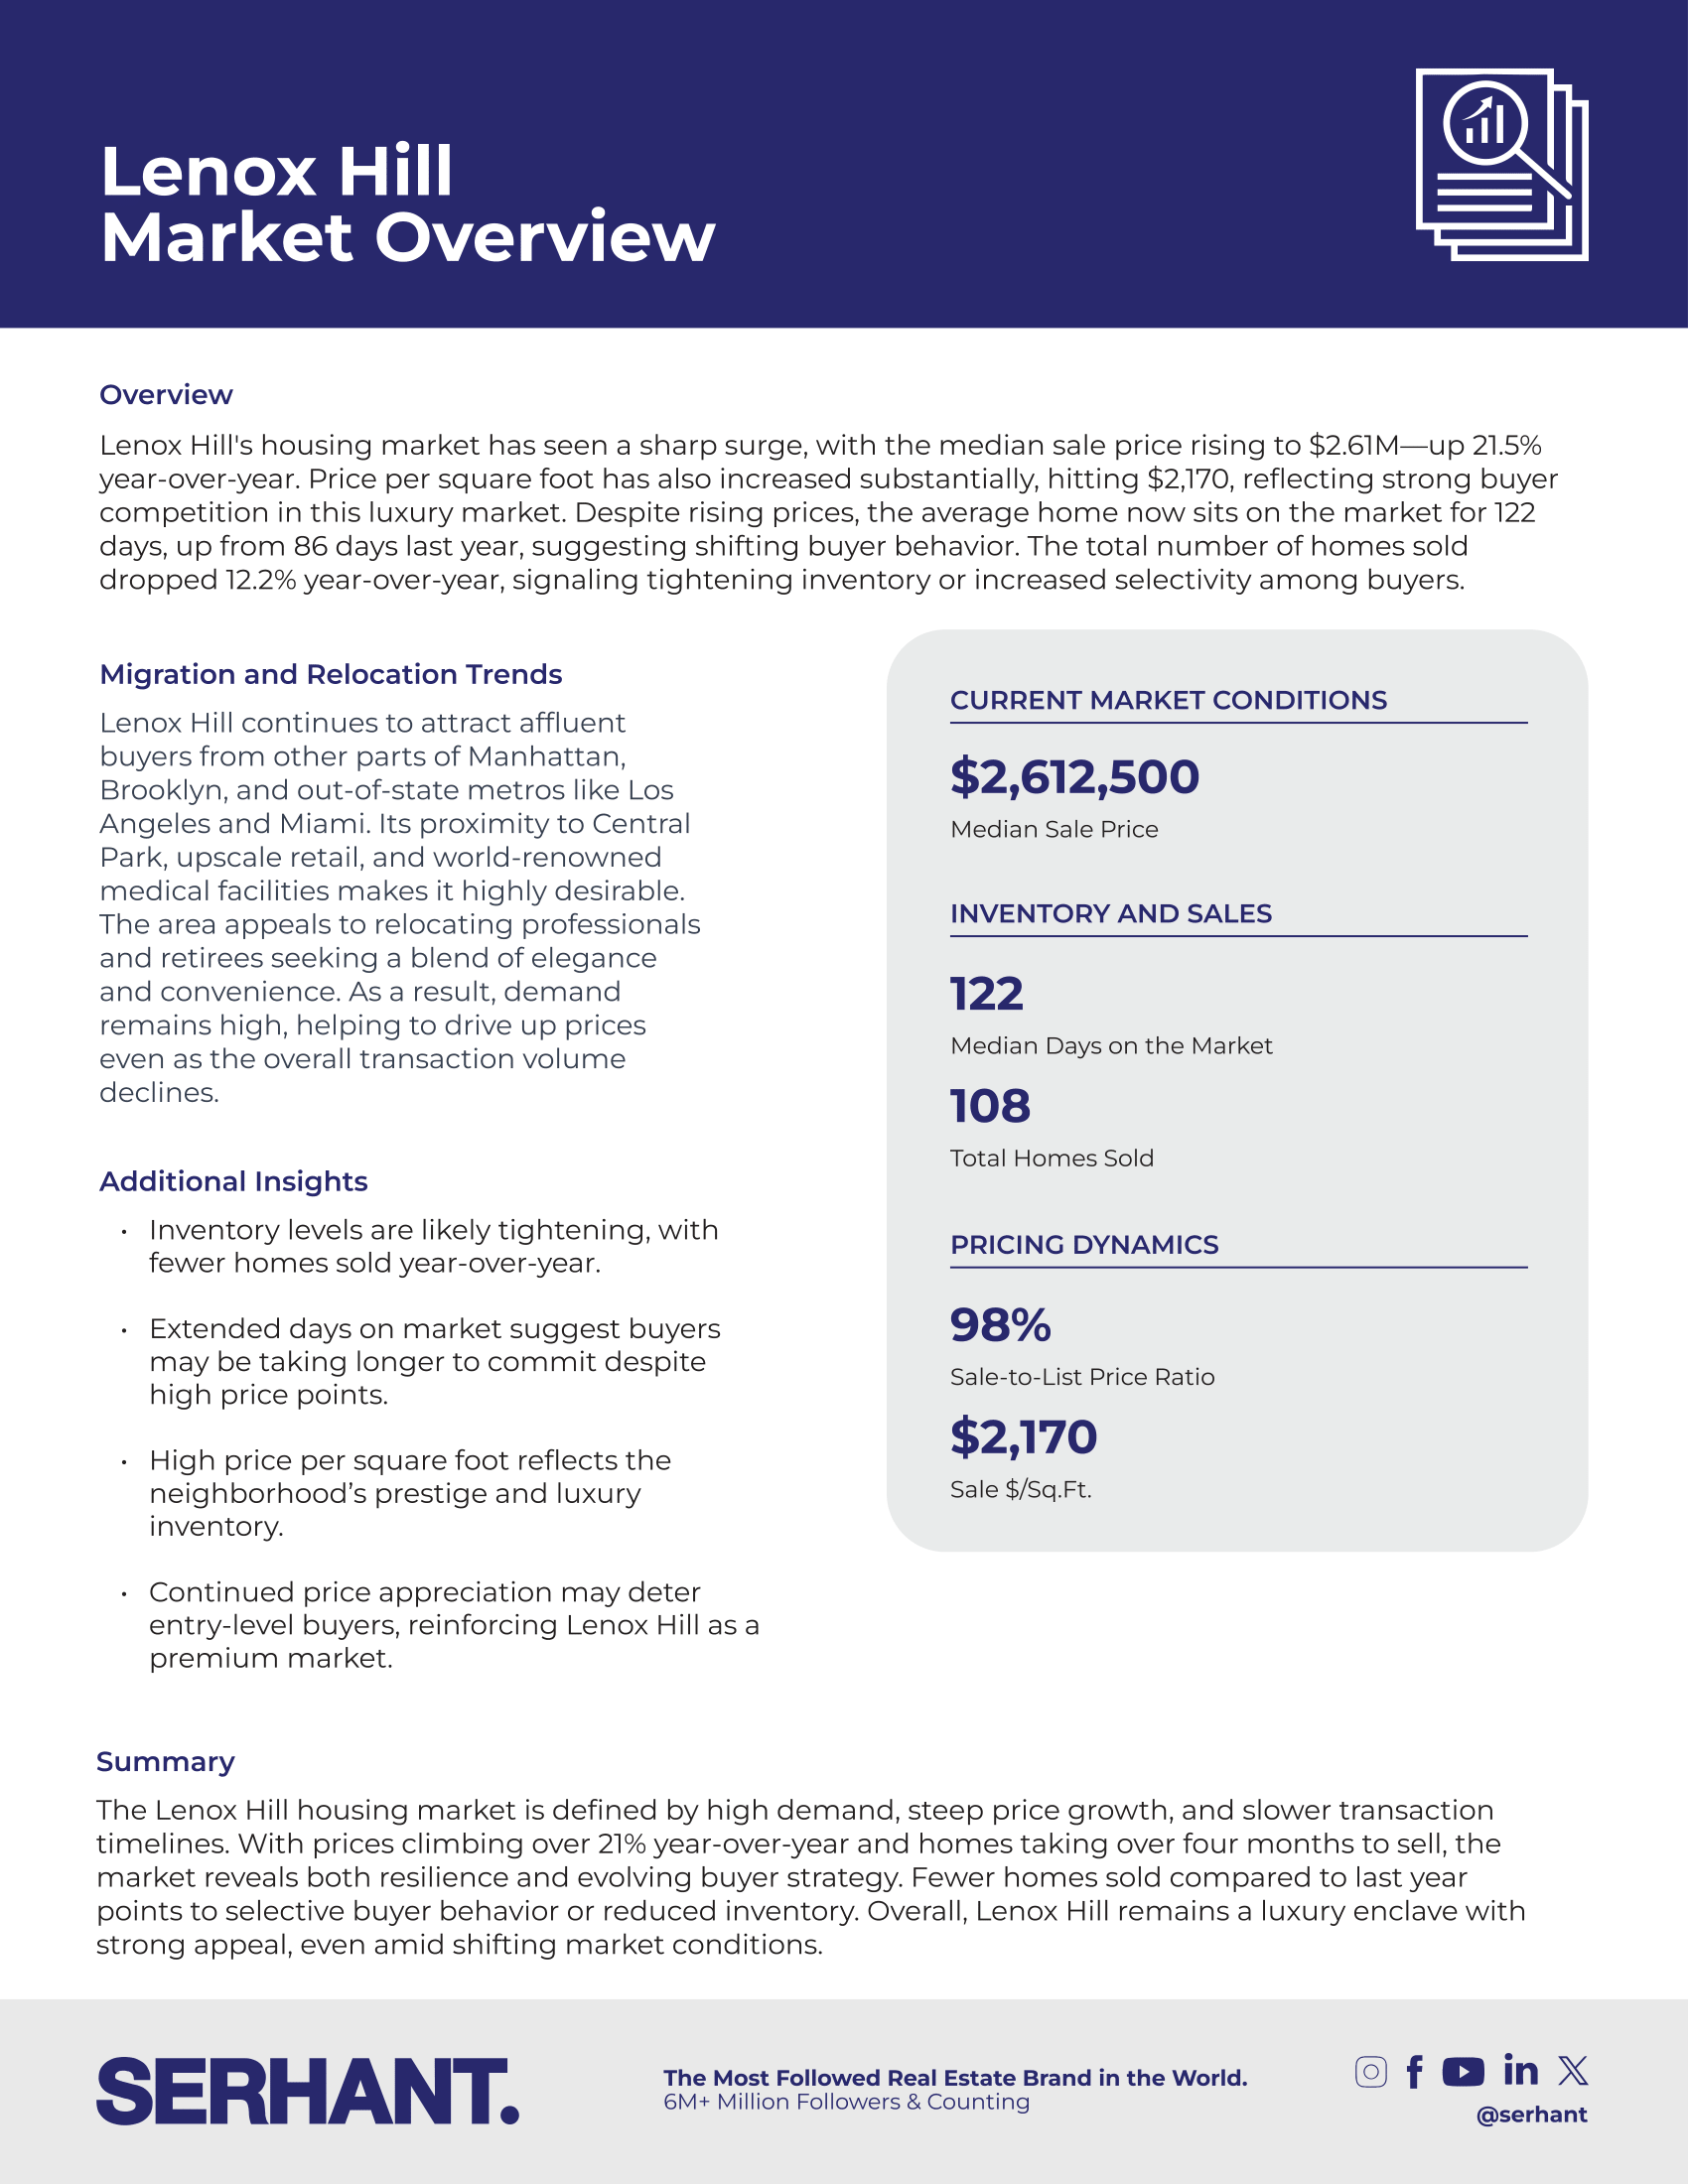
Lenox Hill market overview infographic with housing trends and current market statistics.Lenox Hill market overview infographic with housing trends and key sales metrics.

Little Italy, NY market overview infographic with March 2025 pricing, inventory, sales, and market trends.

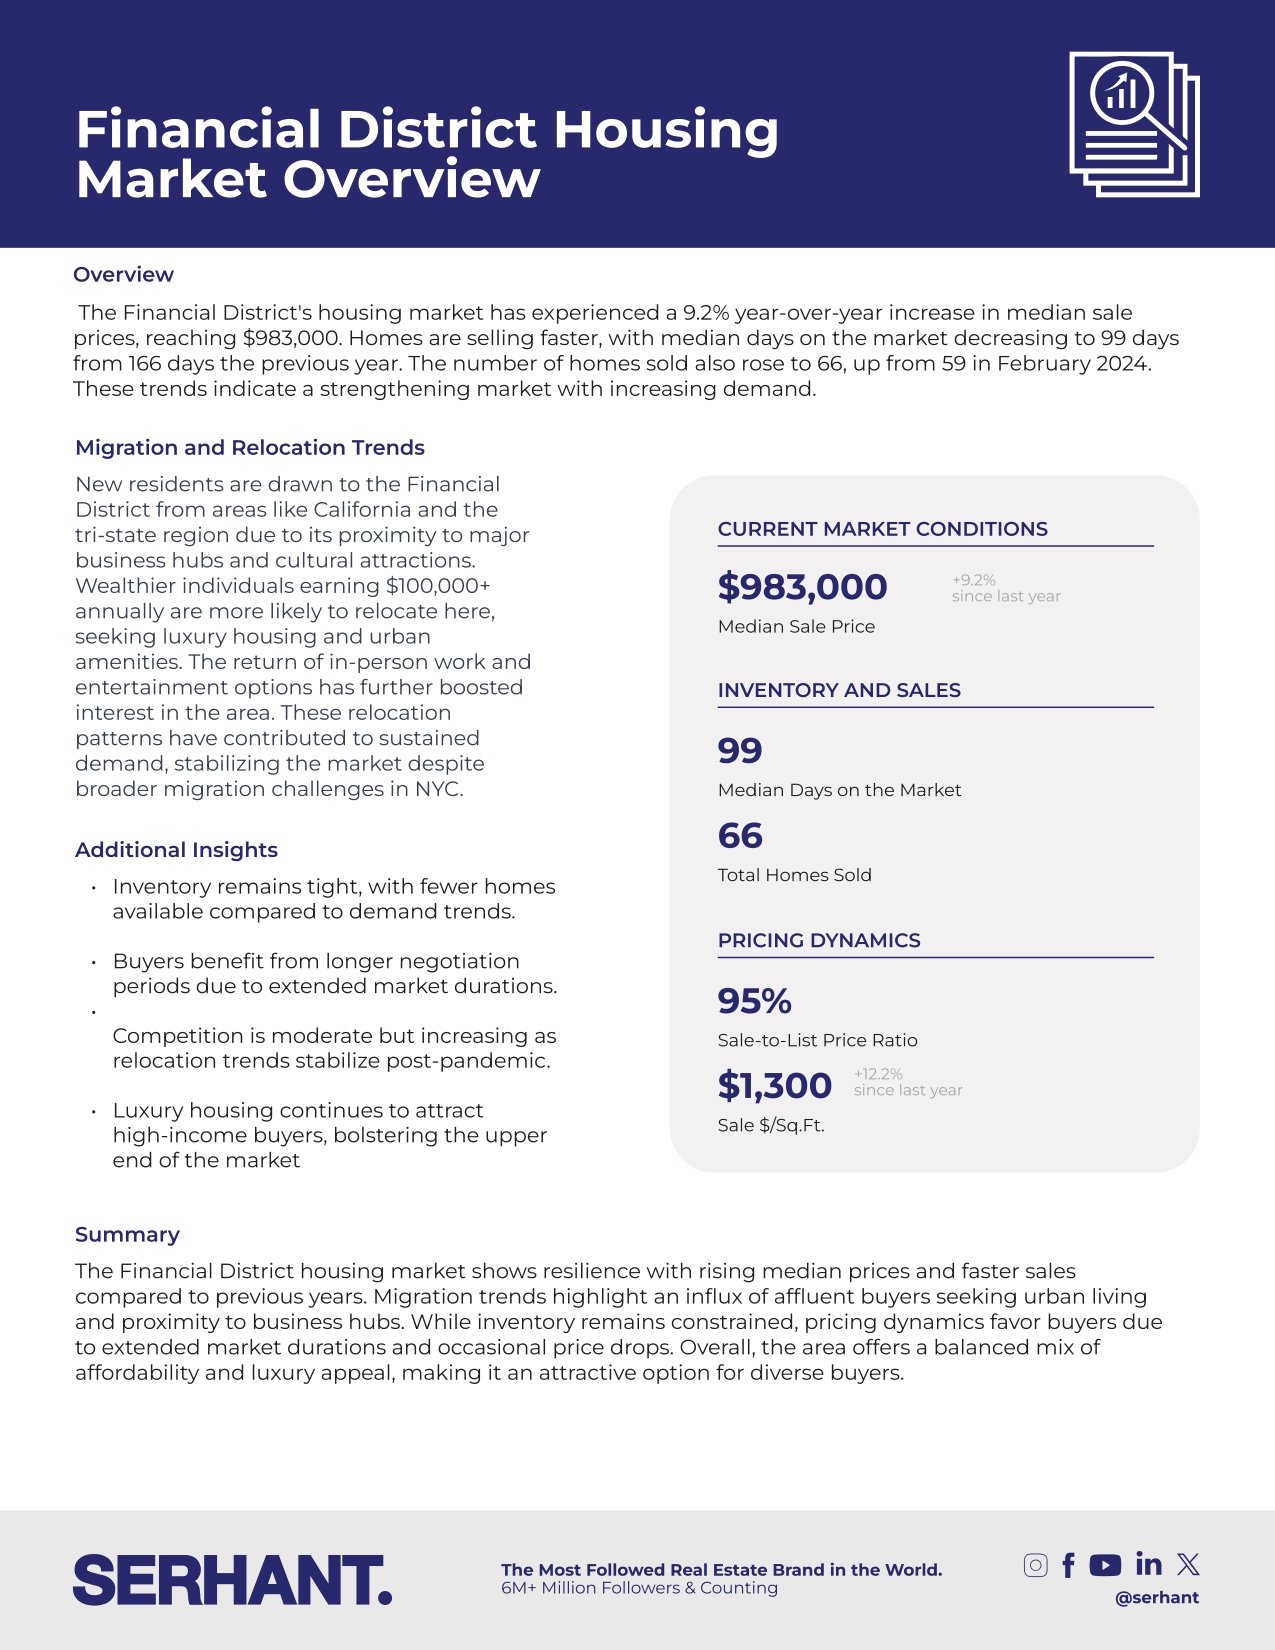
Financial District housing market infographic with pricing, sales, migration trends, and market summary.

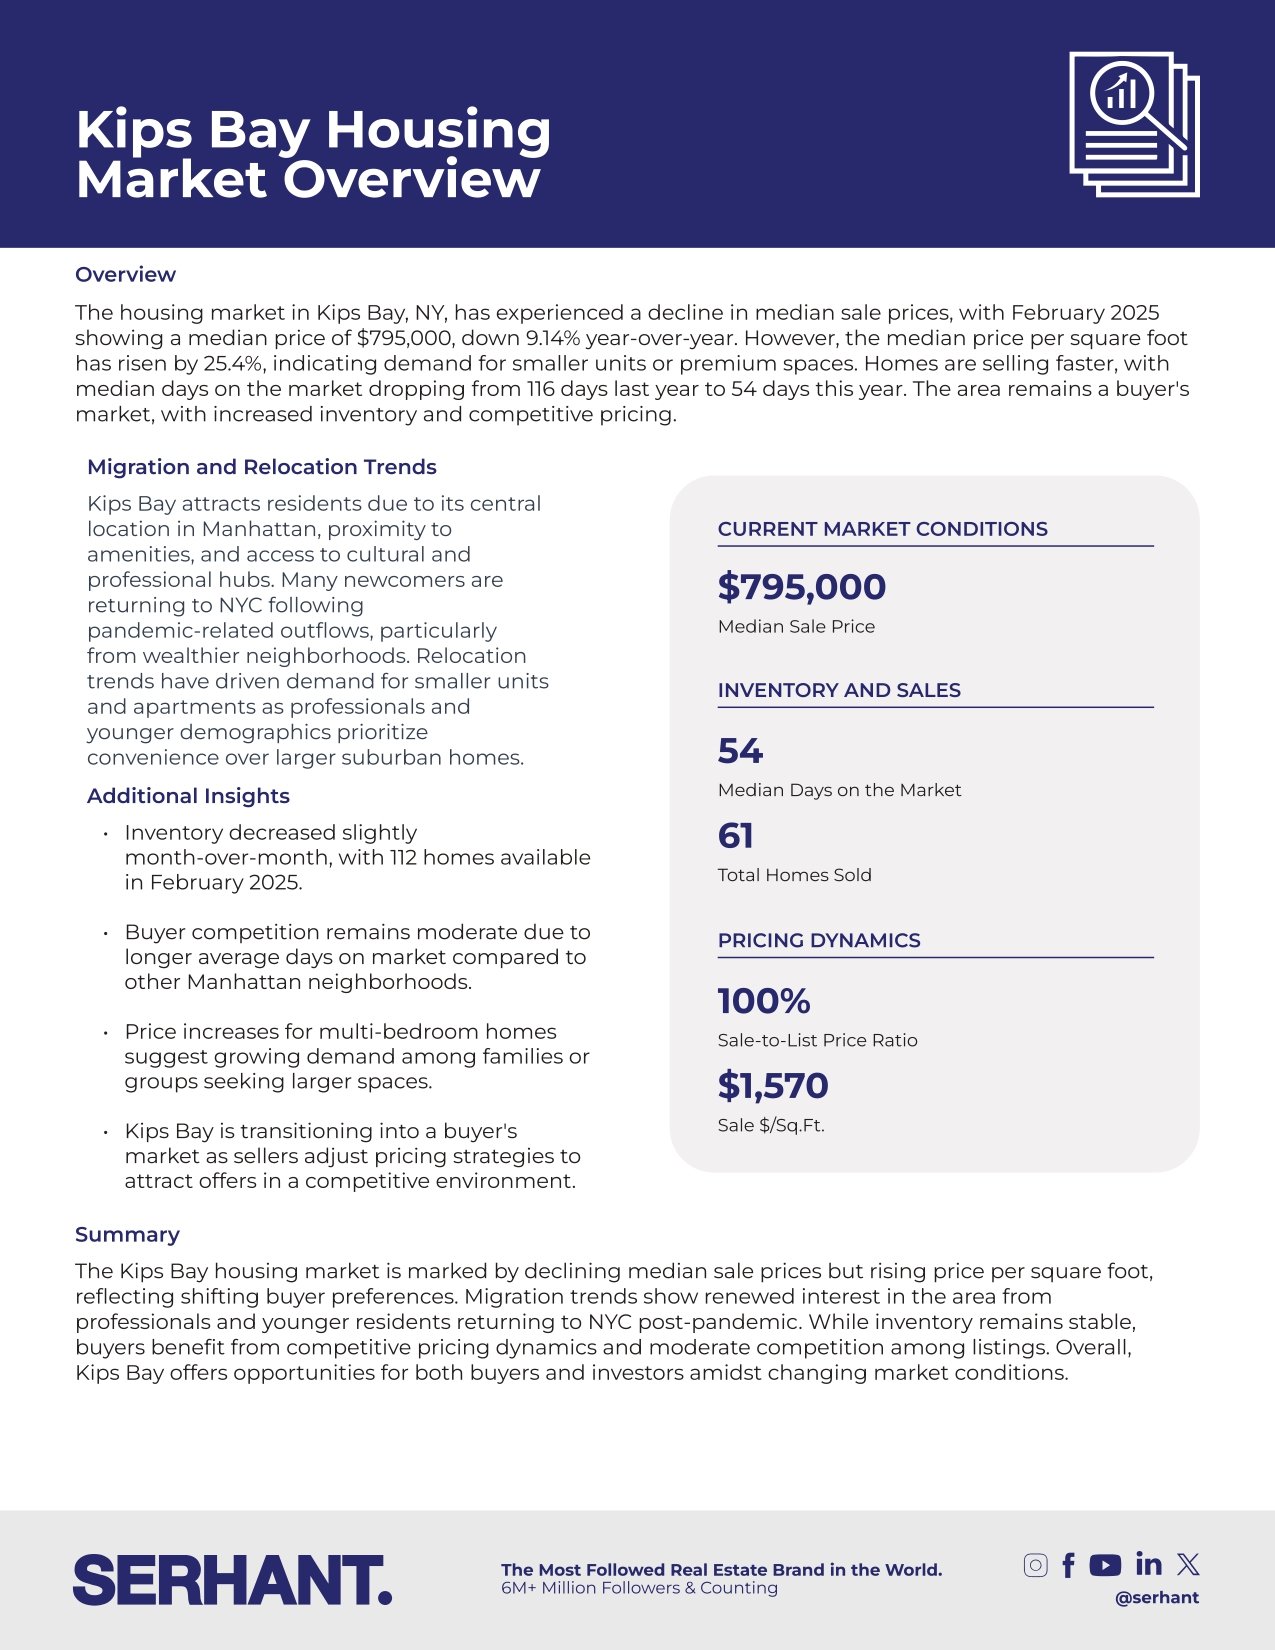
Kips Bay housing market infographic with February 2025 sales statistics, trends, and Serhant branding.

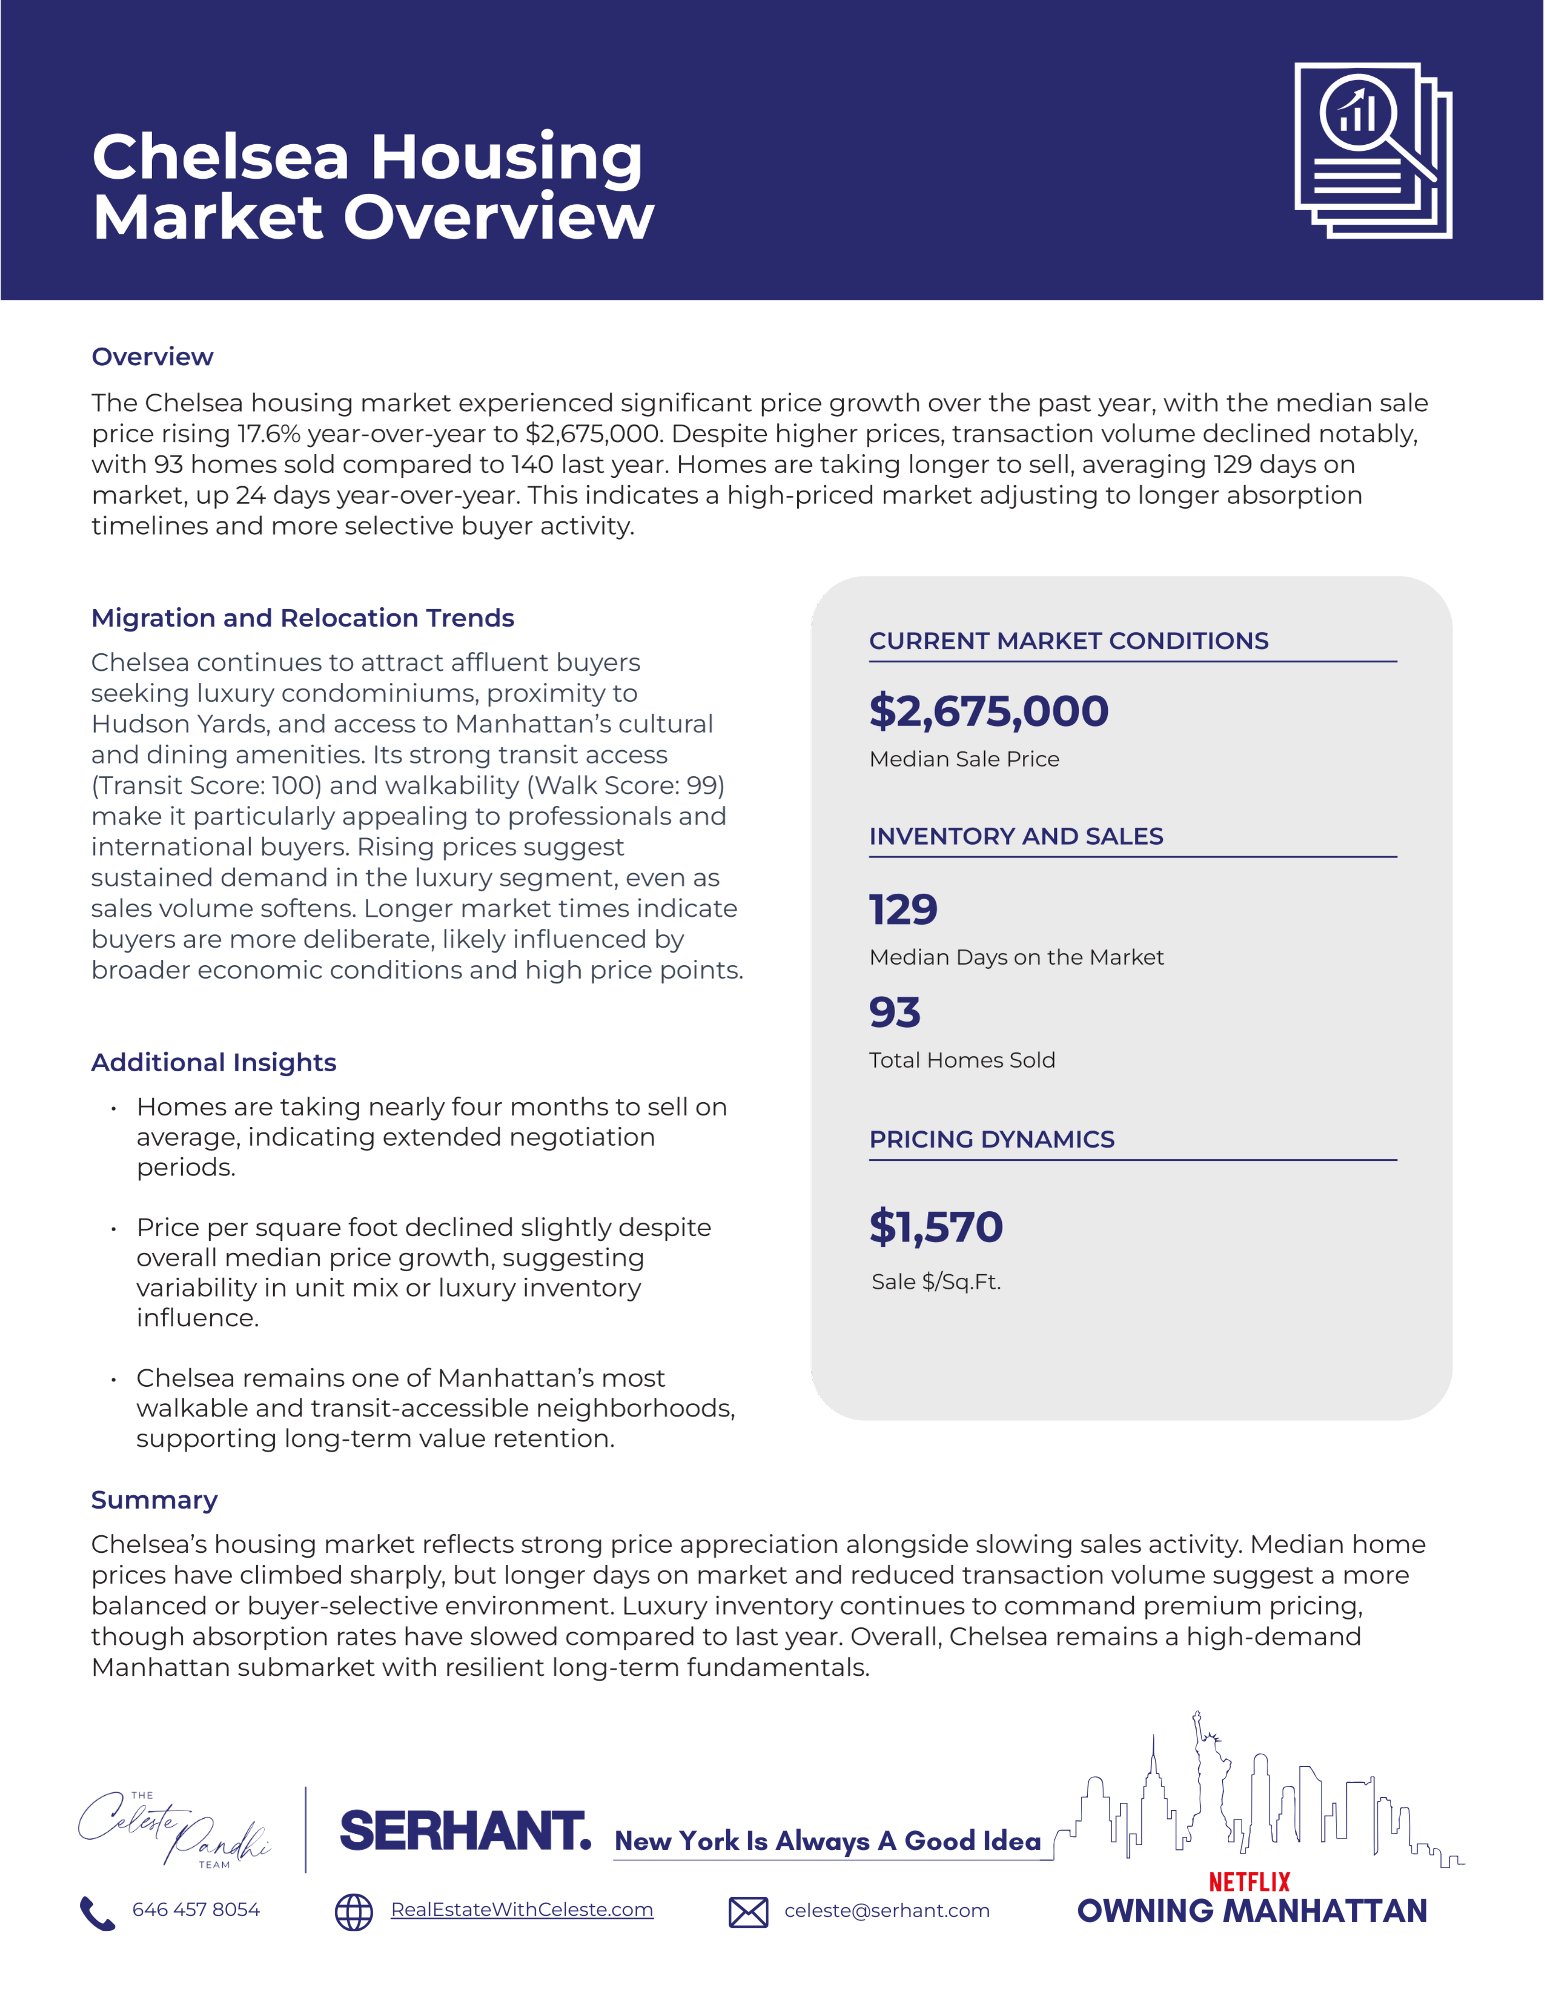
Chelsea housing market overview infographic with pricing, sales, market-time statistics, neighborhood trends, and team branding.


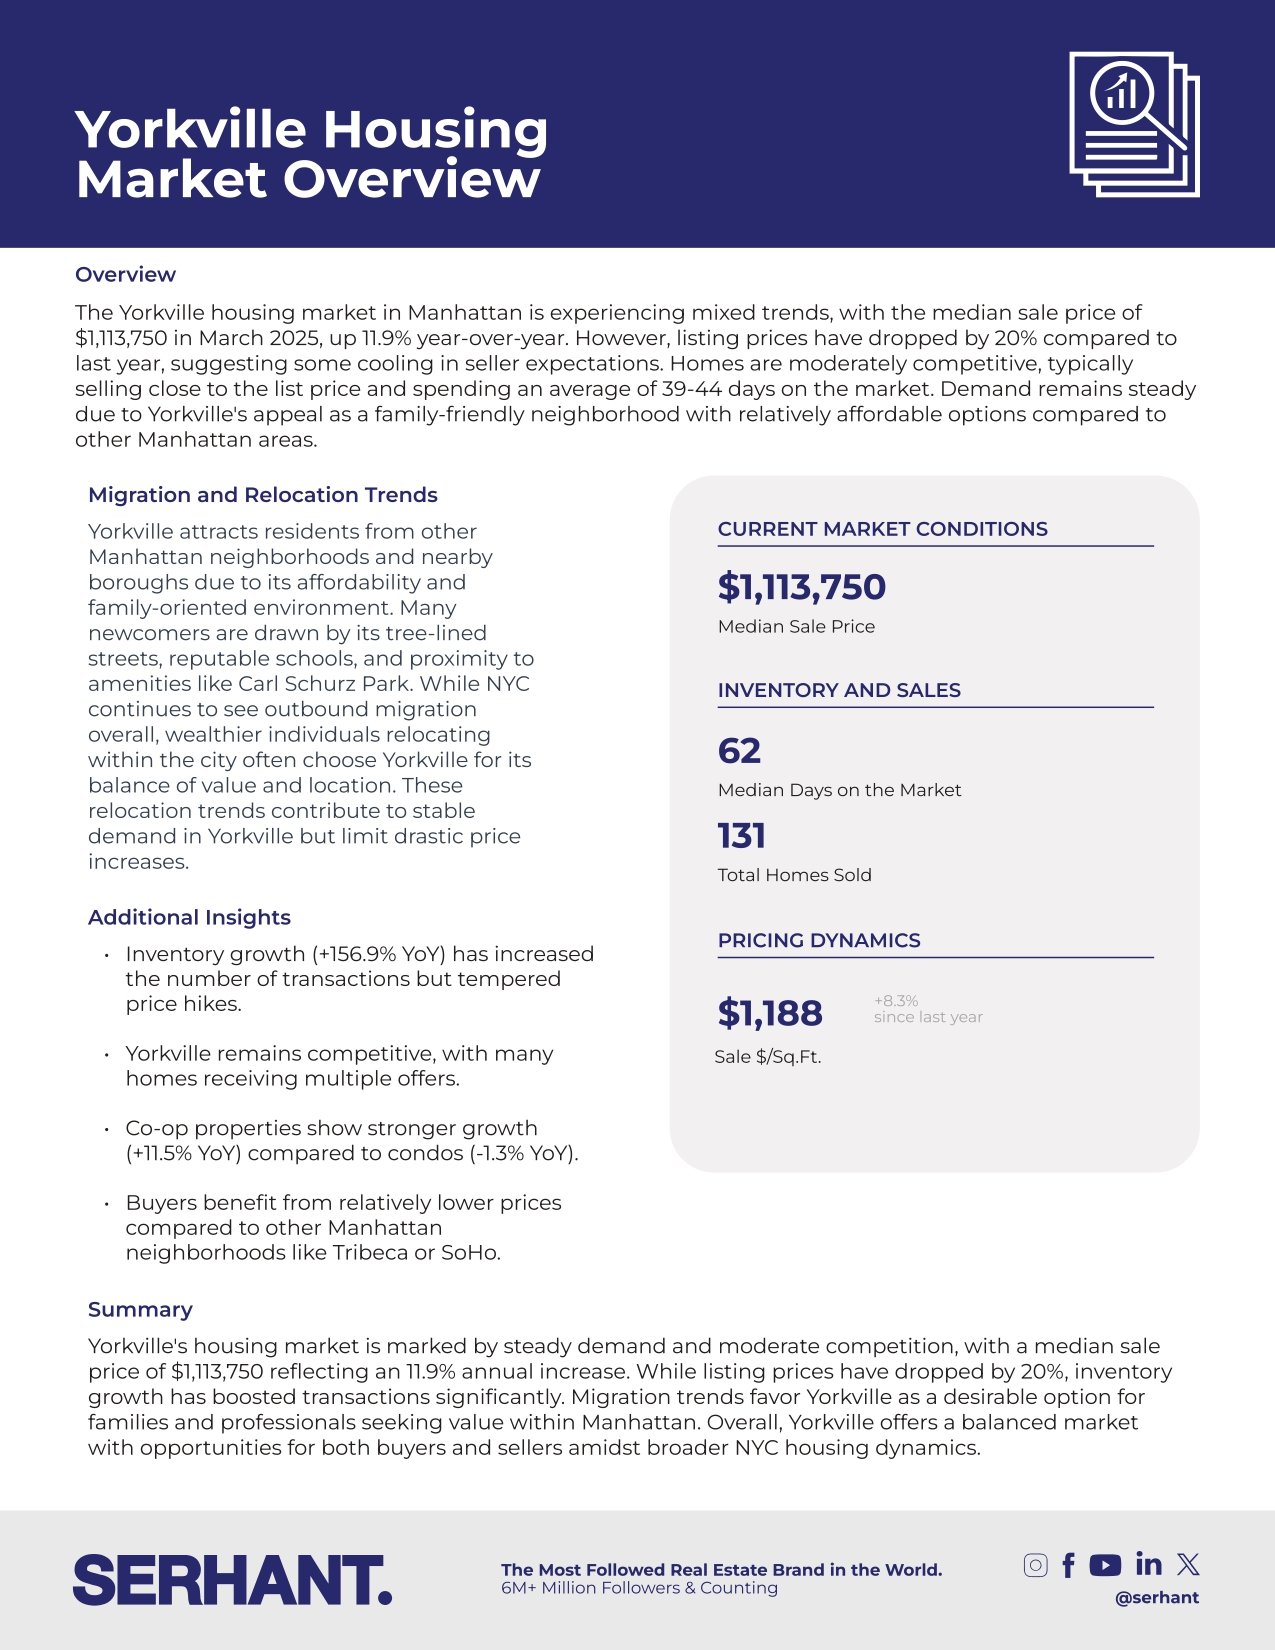
Yorkville housing market infographic with market trends, sale prices, days on market, and sales figures.

Sutton Place housing market overview with pricing, sales, market-time statistics, and neighborhood trends.

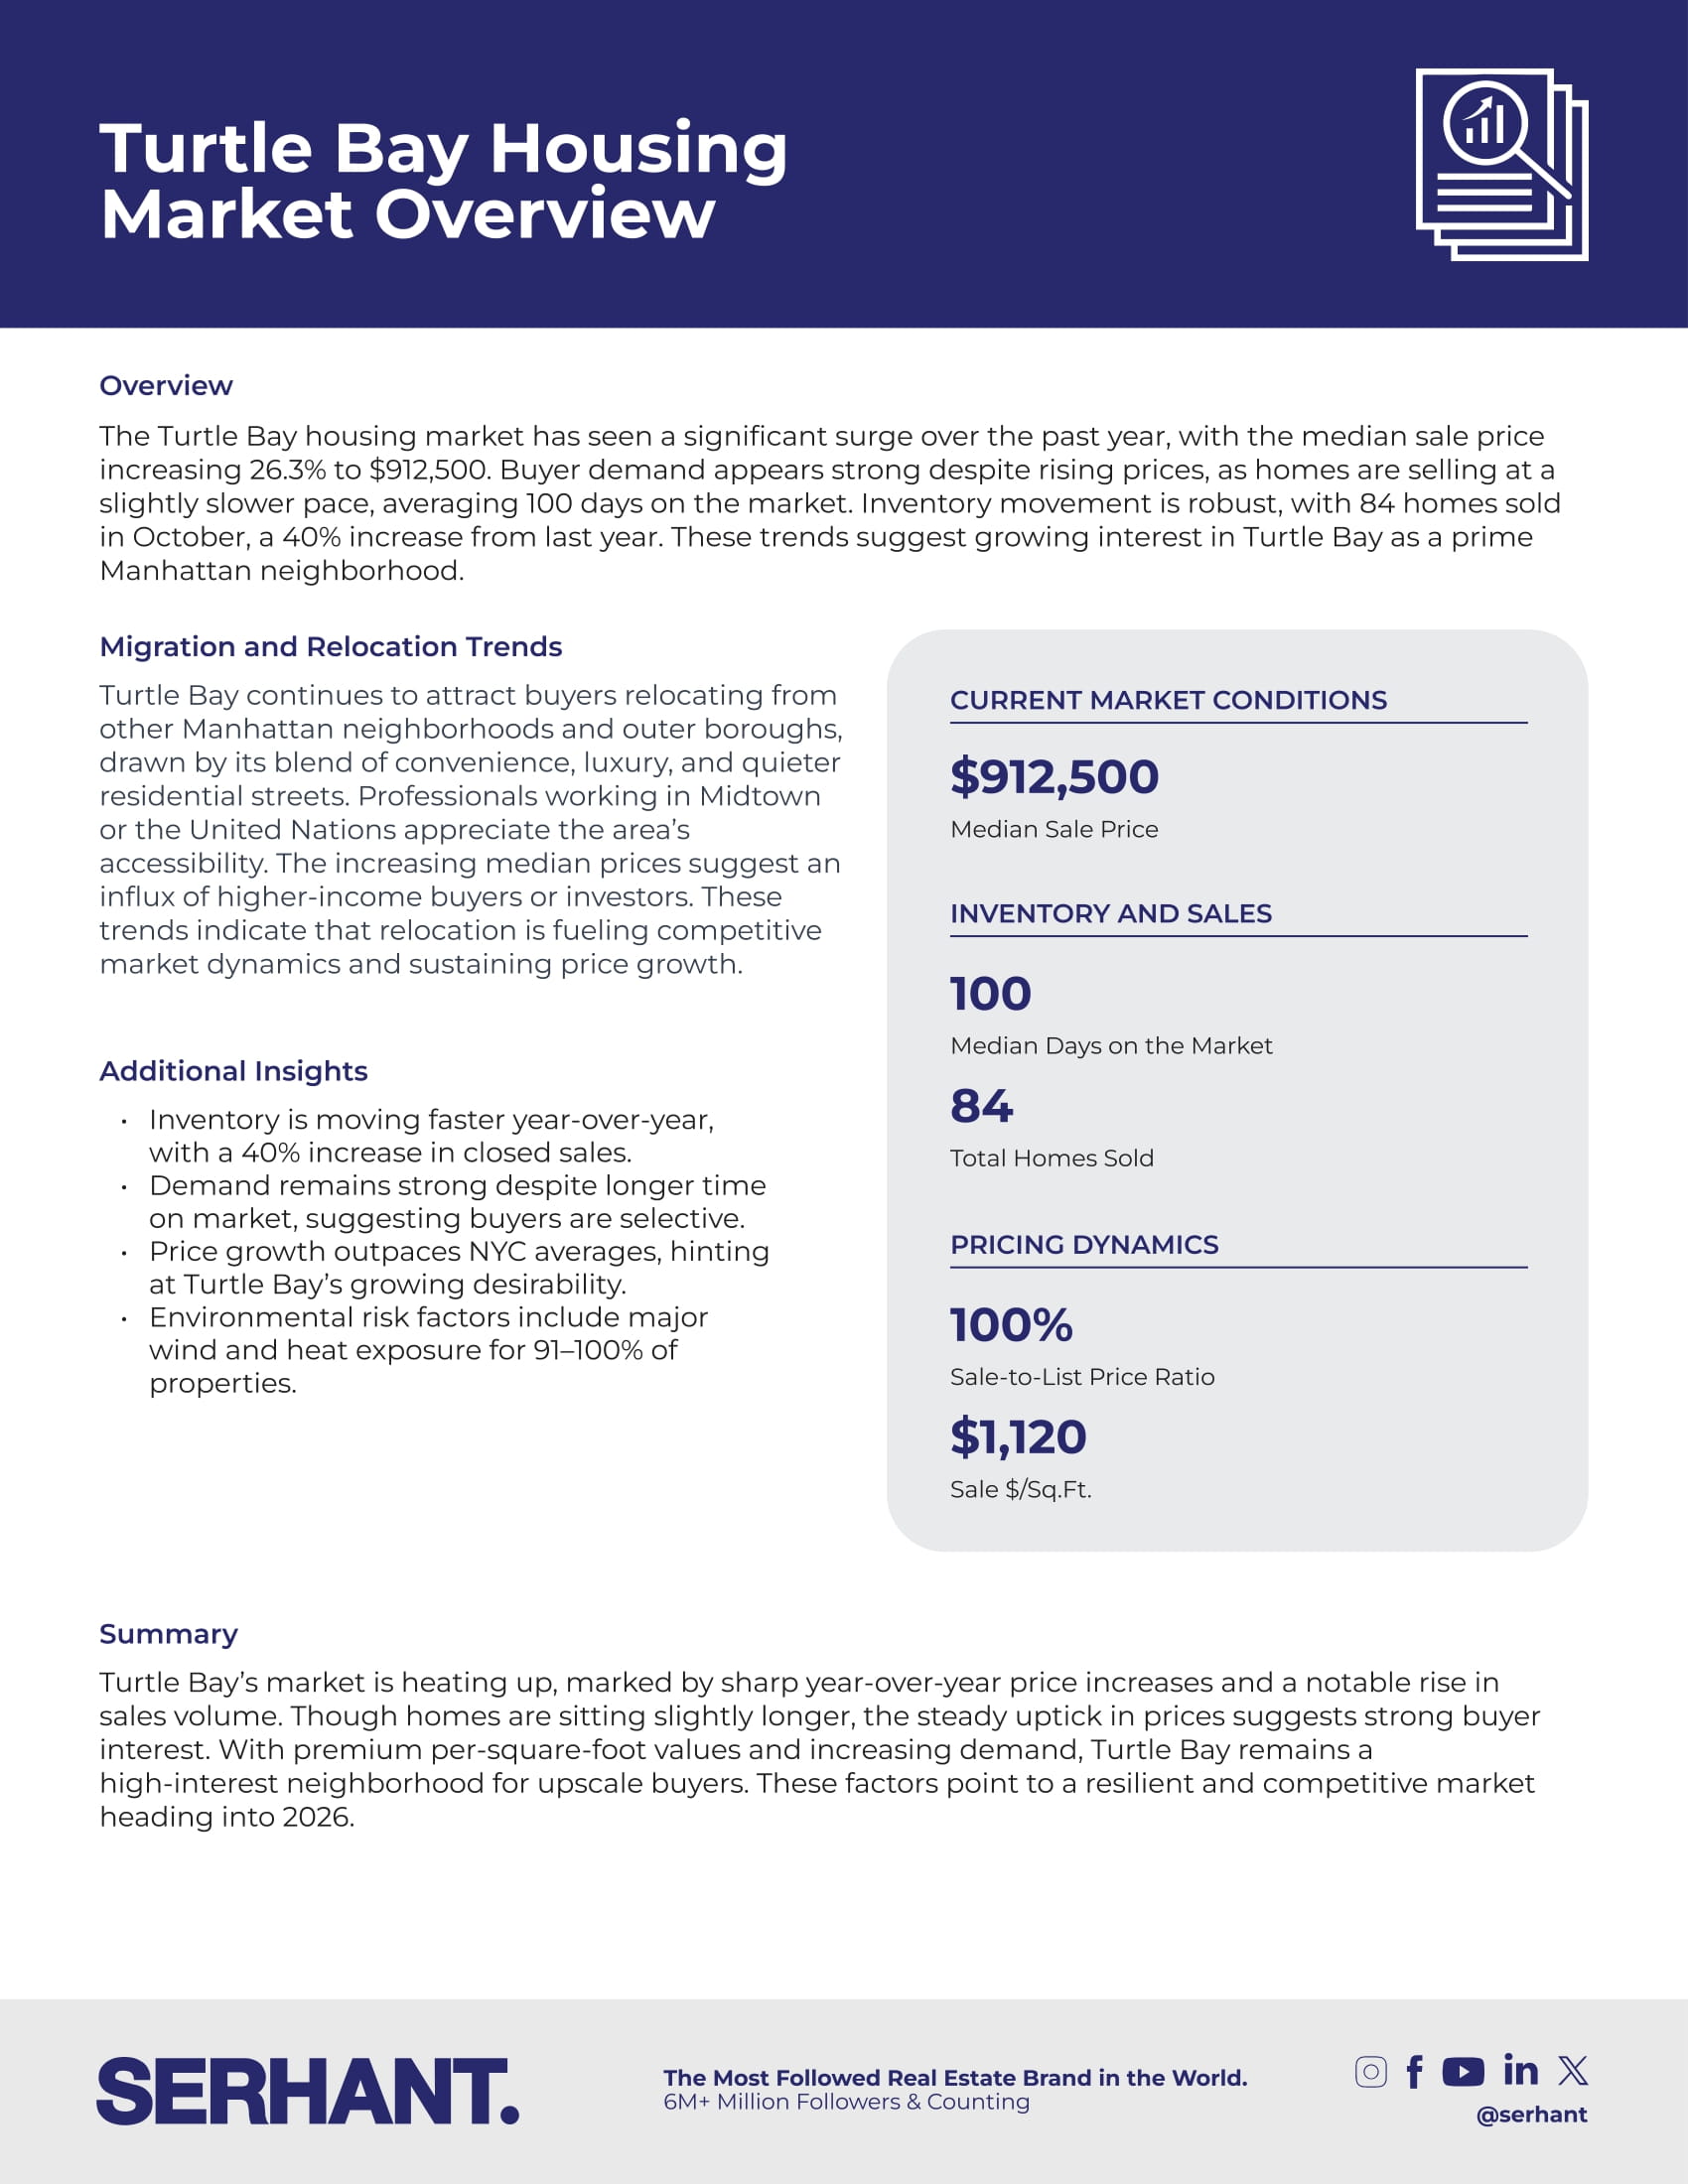
Turtle Bay housing market overview infographic with market statistics, buyer trends, and SERHANT branding.

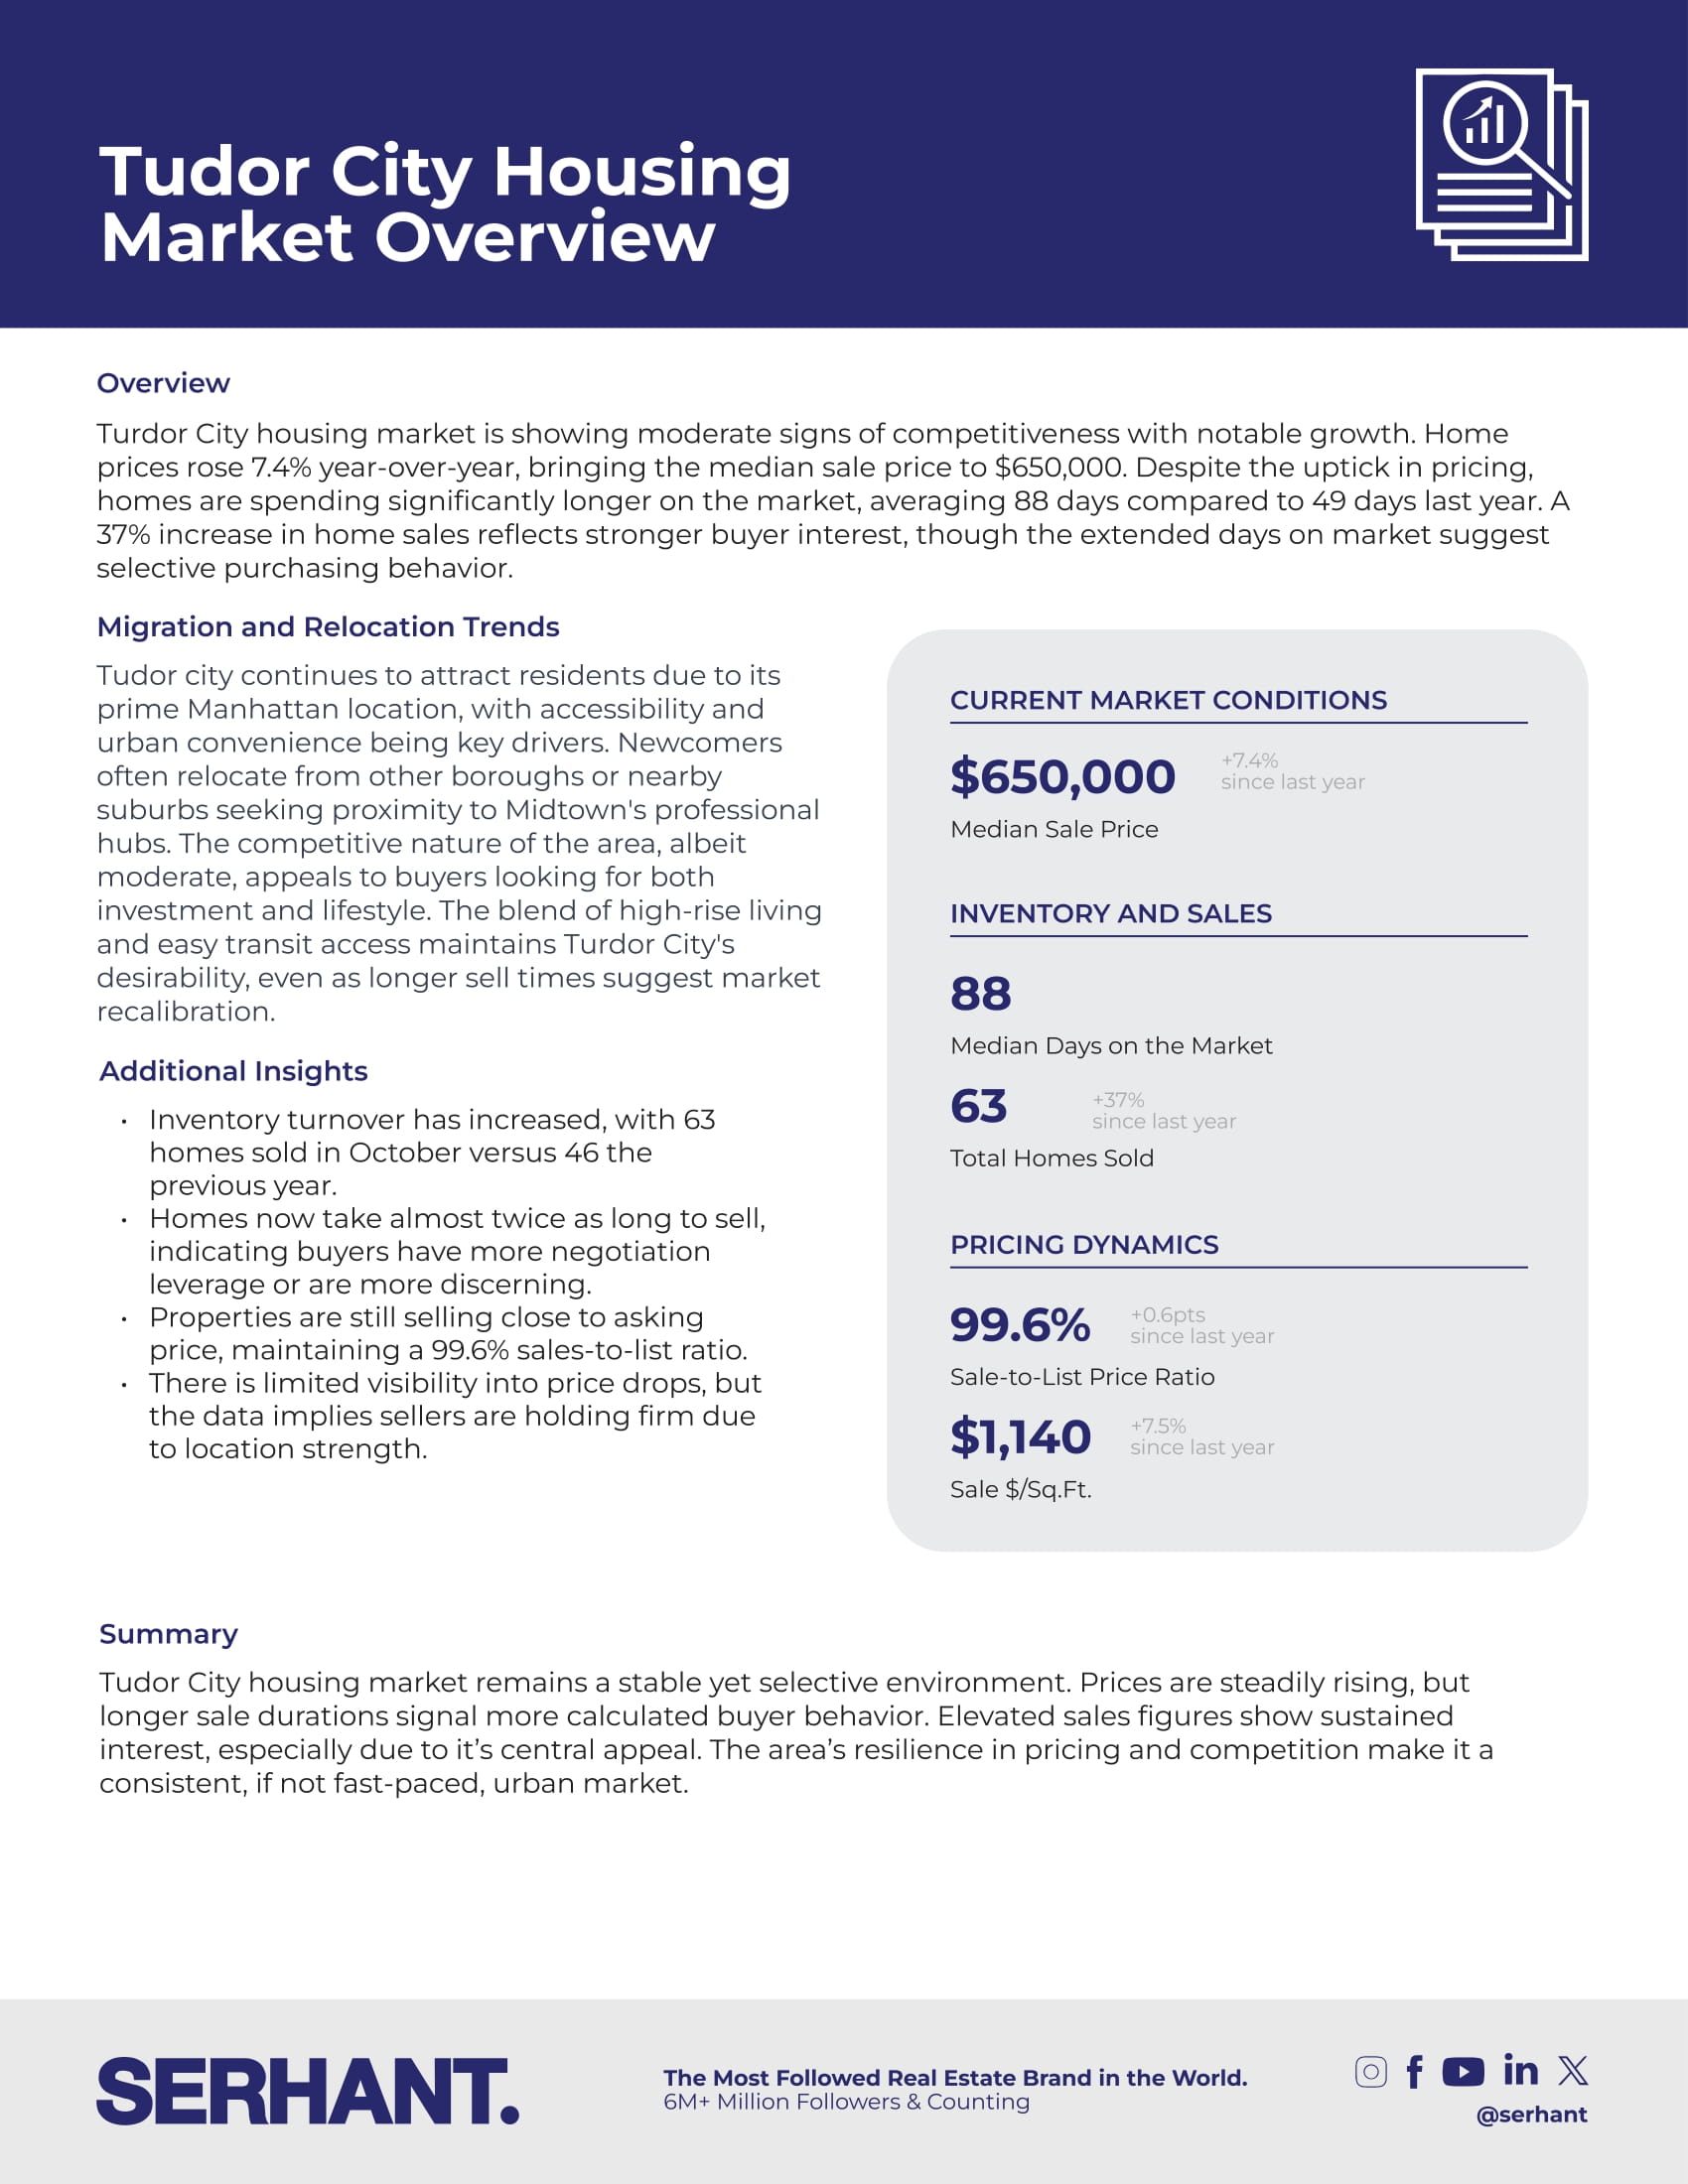
Tudor City housing market overview with prices, sales, inventory, and market trends.

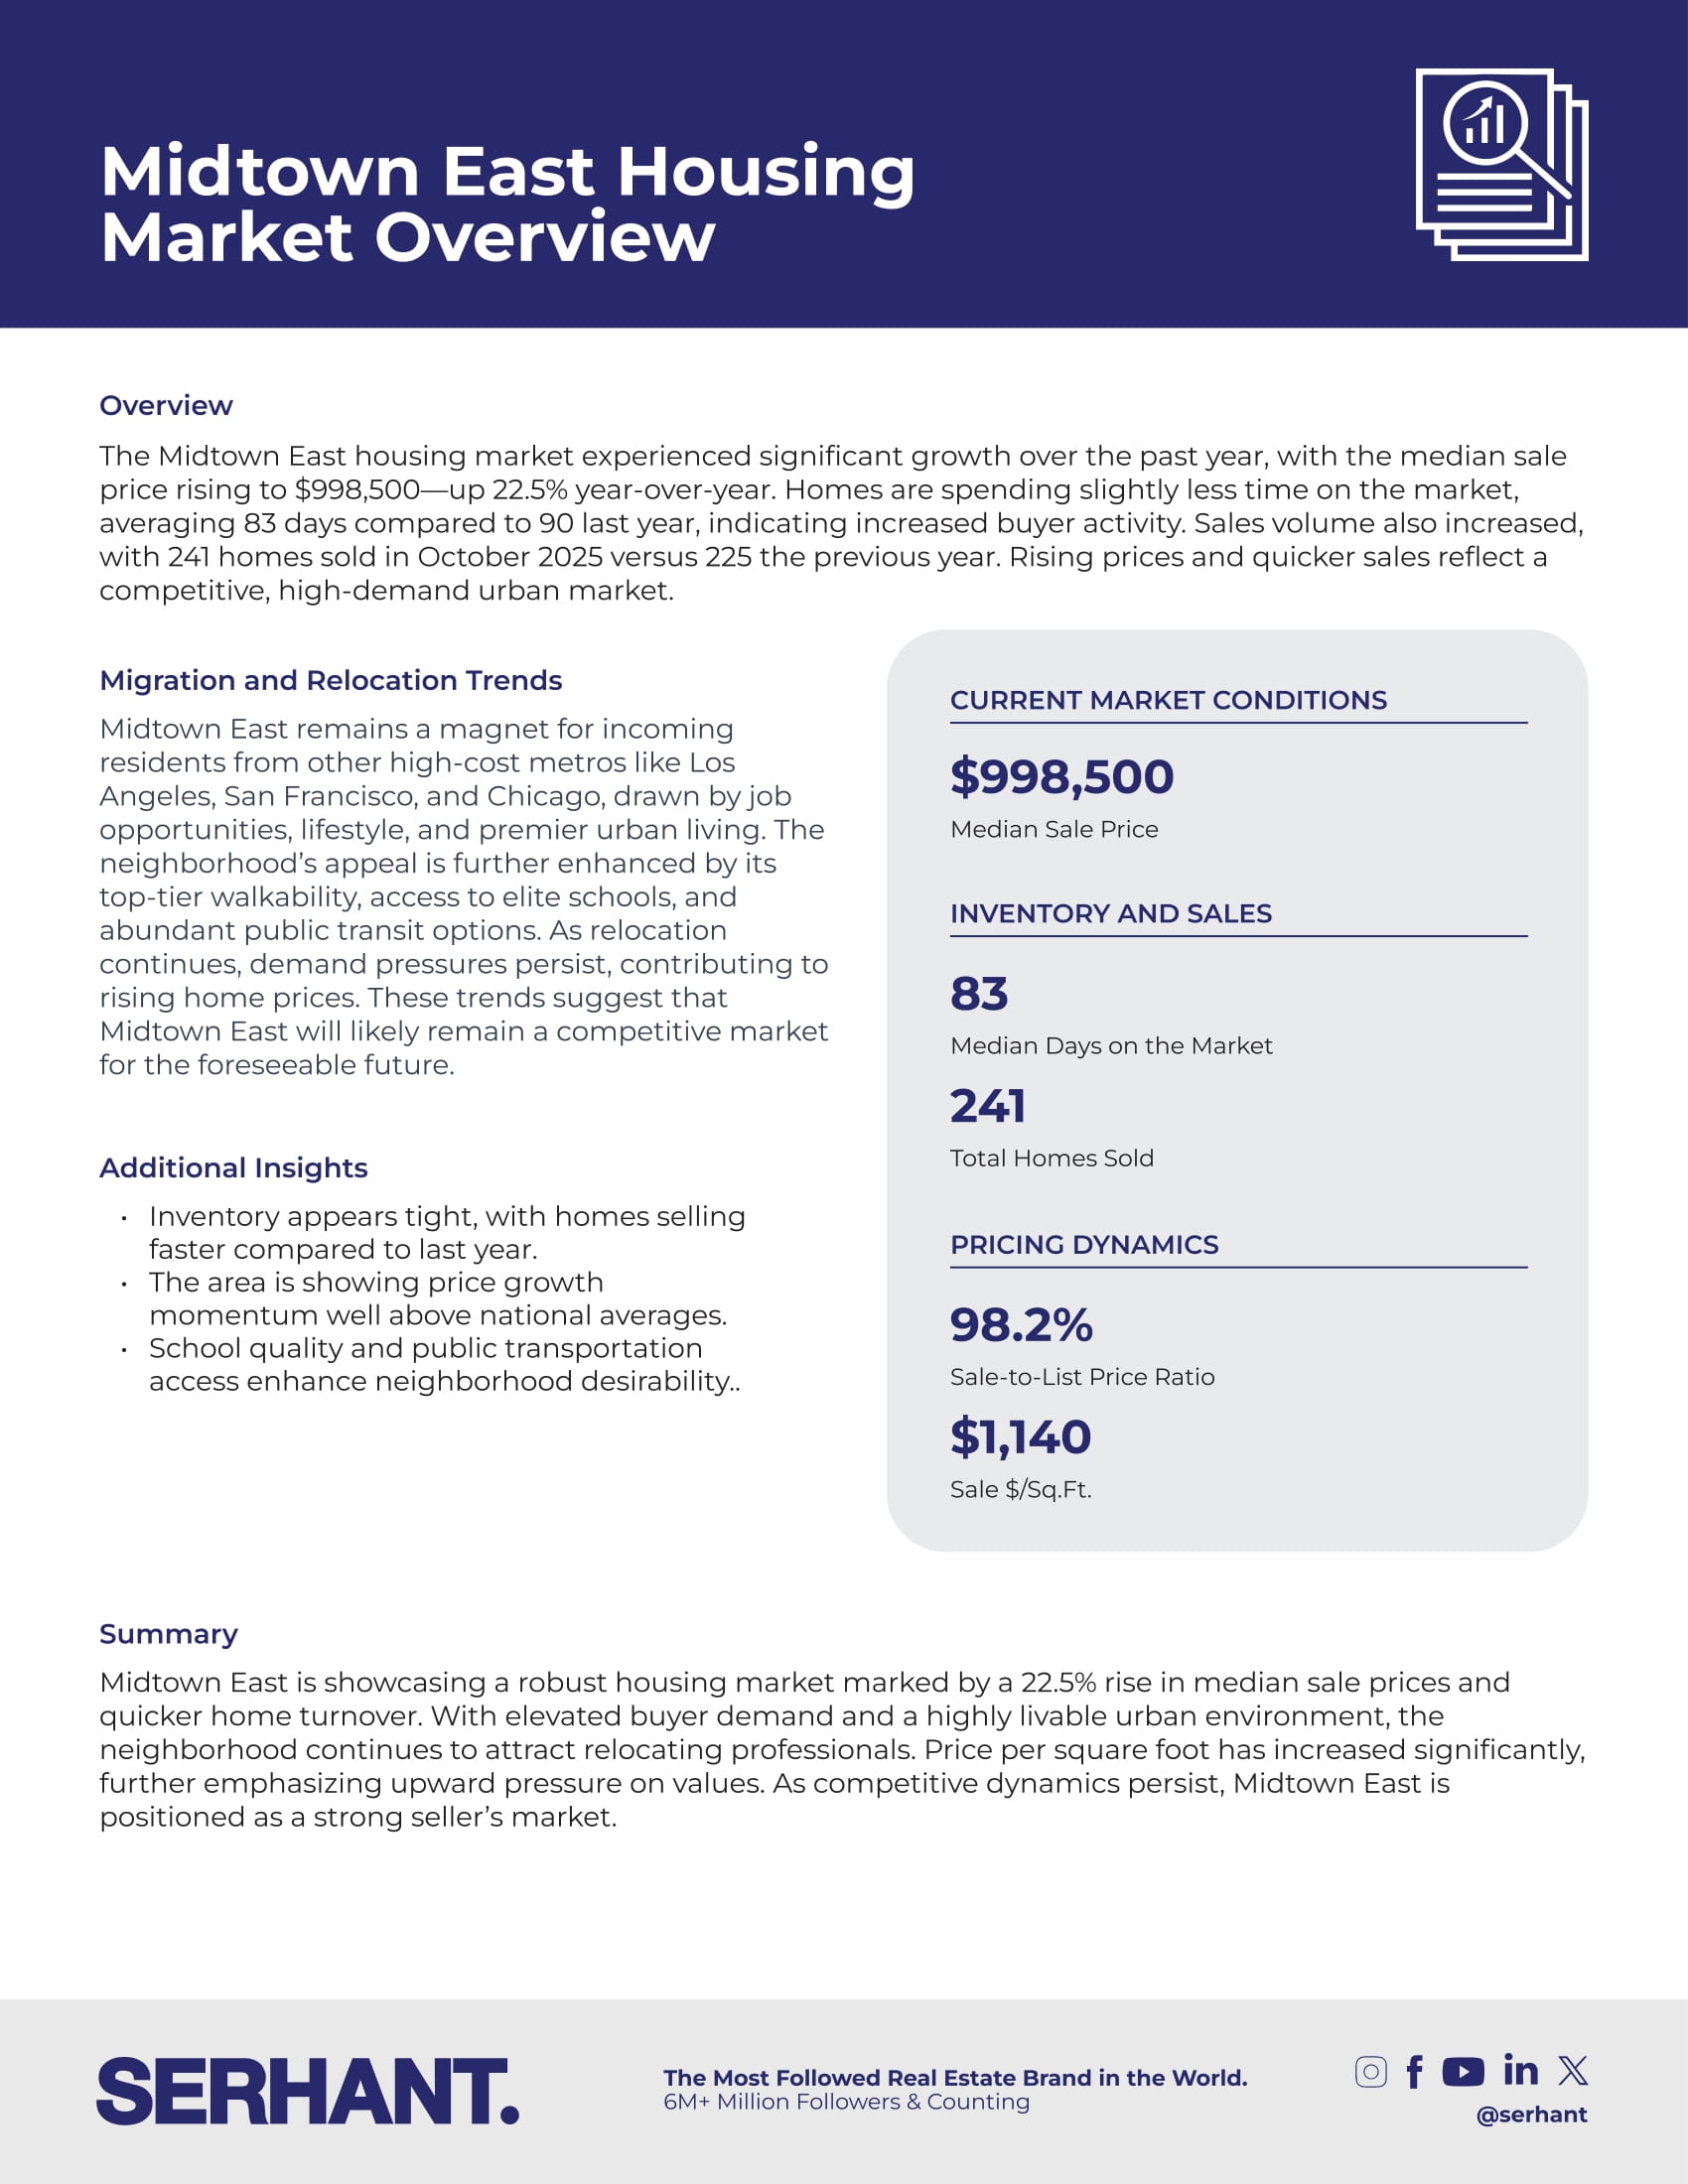
Midtown East housing market overview with pricing, sales, inventory, migration trends, and market summary.

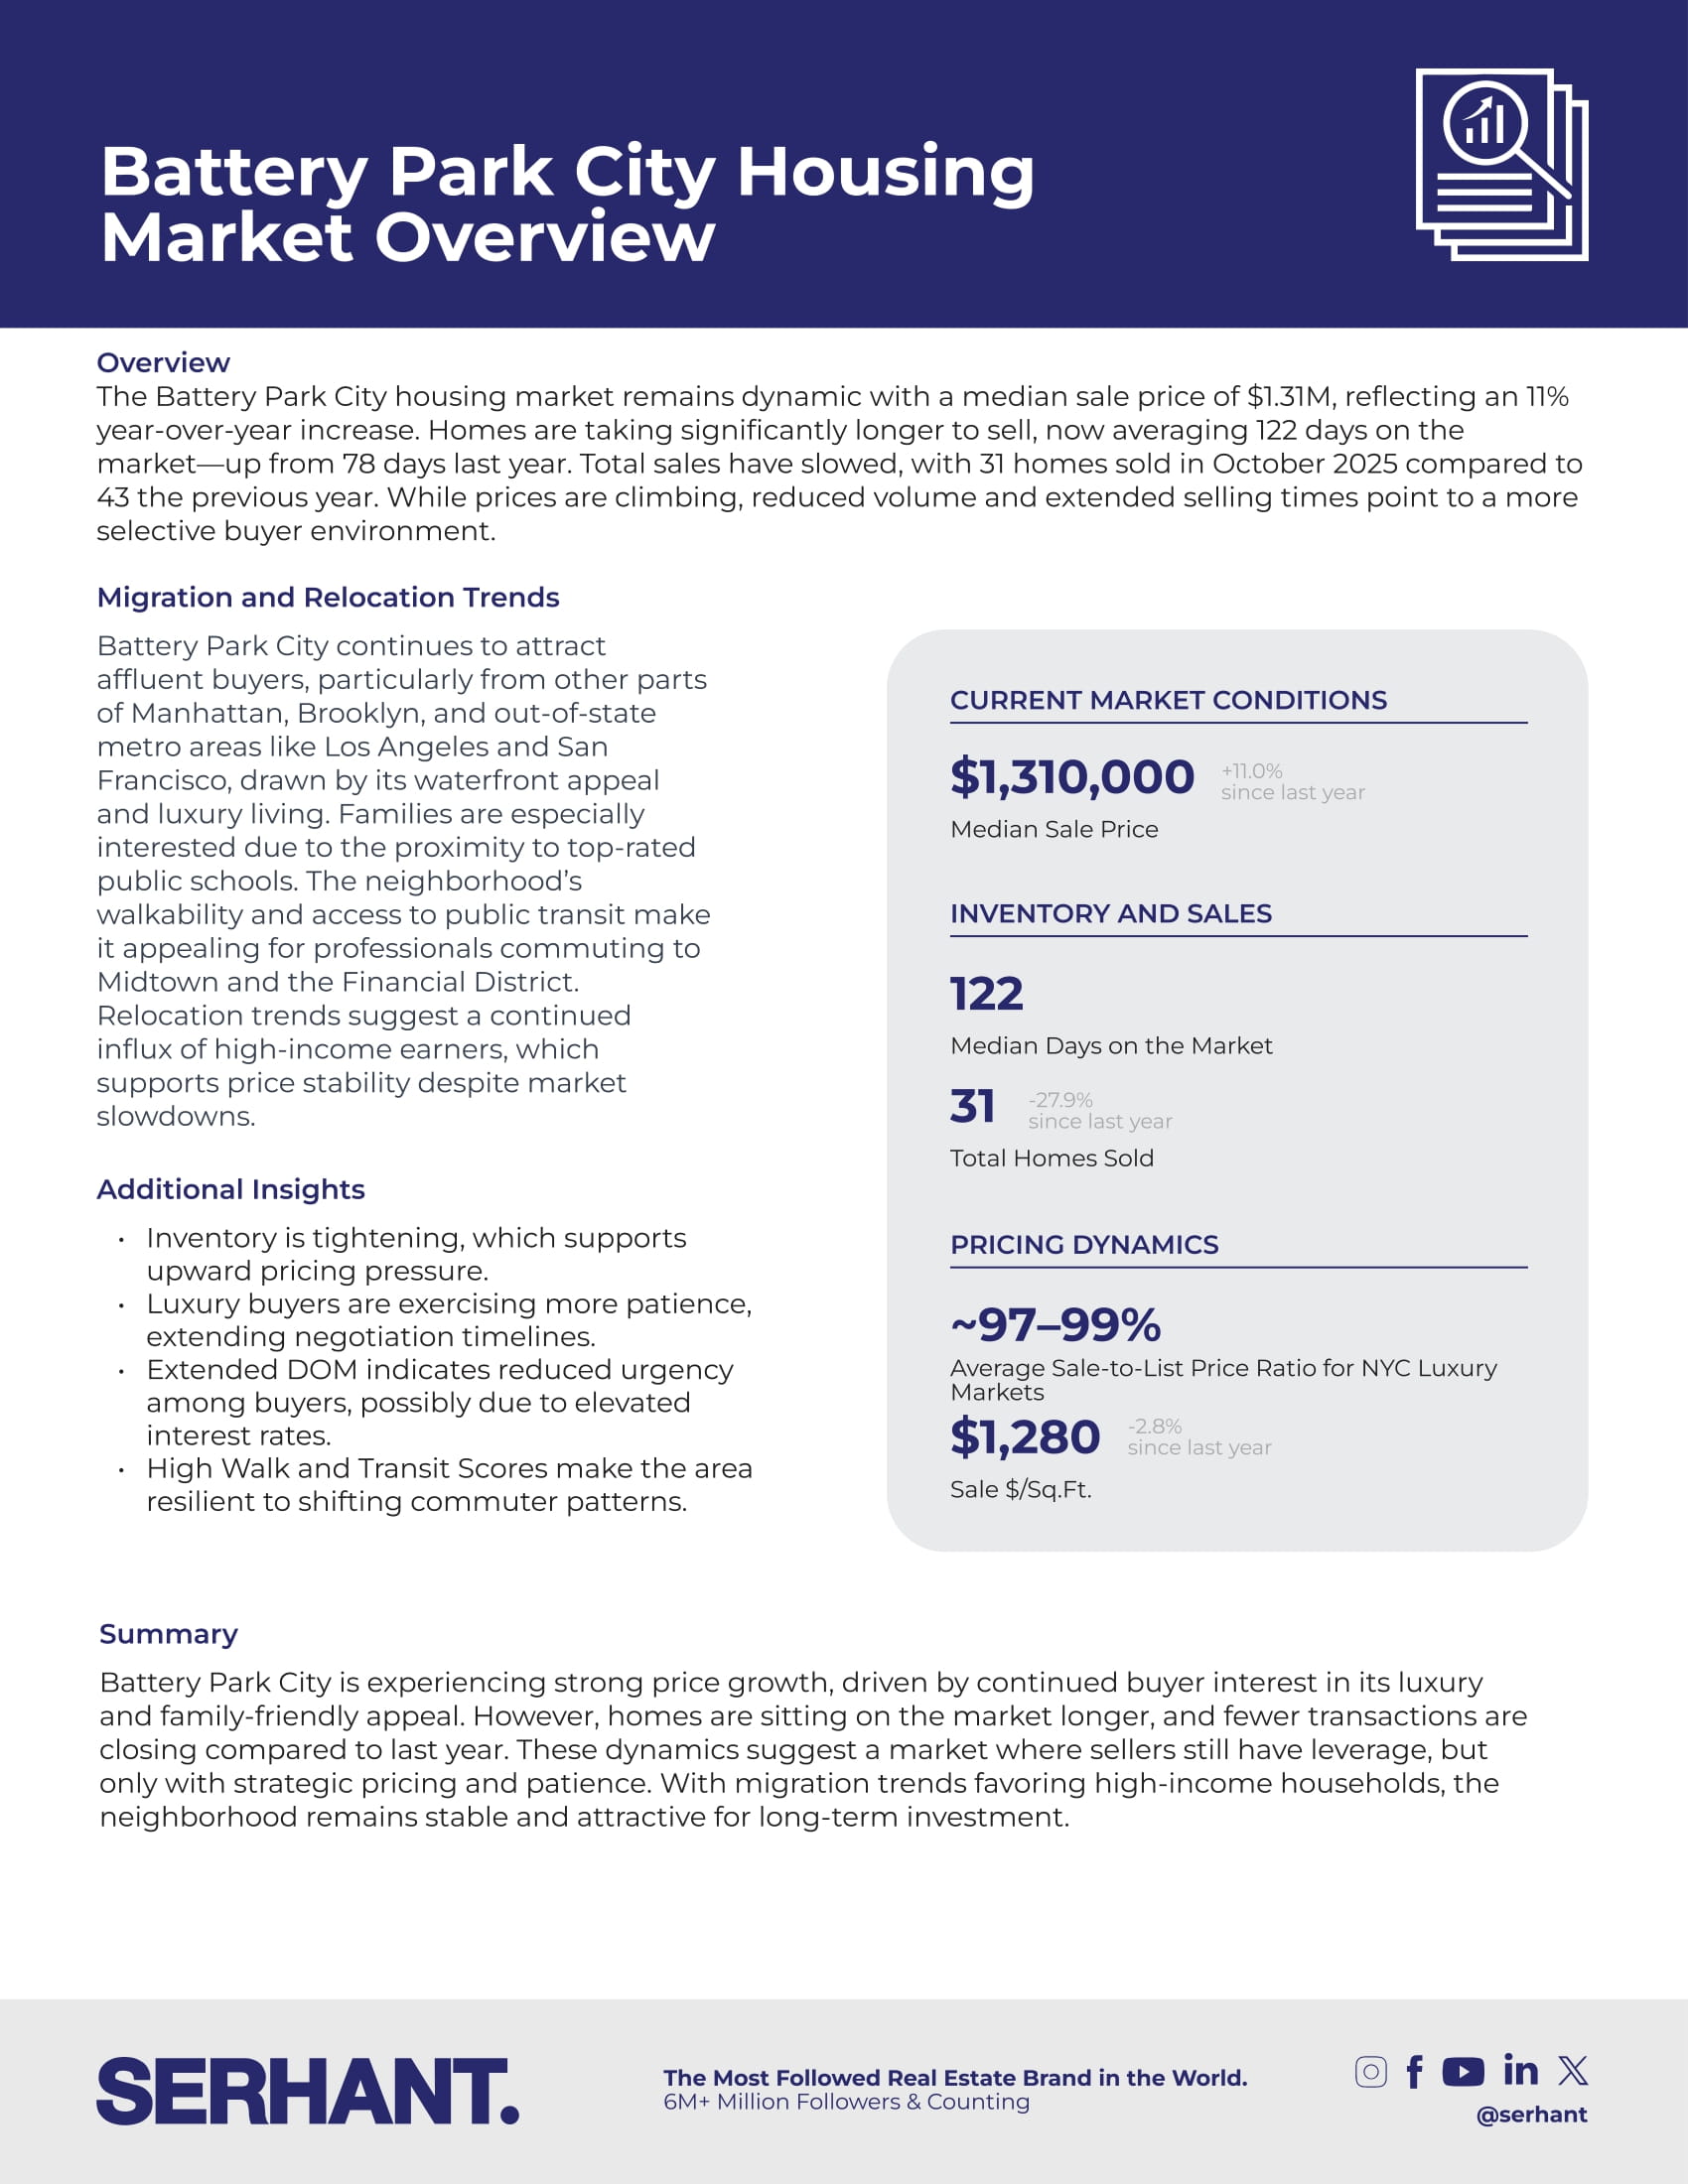
Battery Park City housing market overview with median sale price, days on market, sales, and pricing statistics.

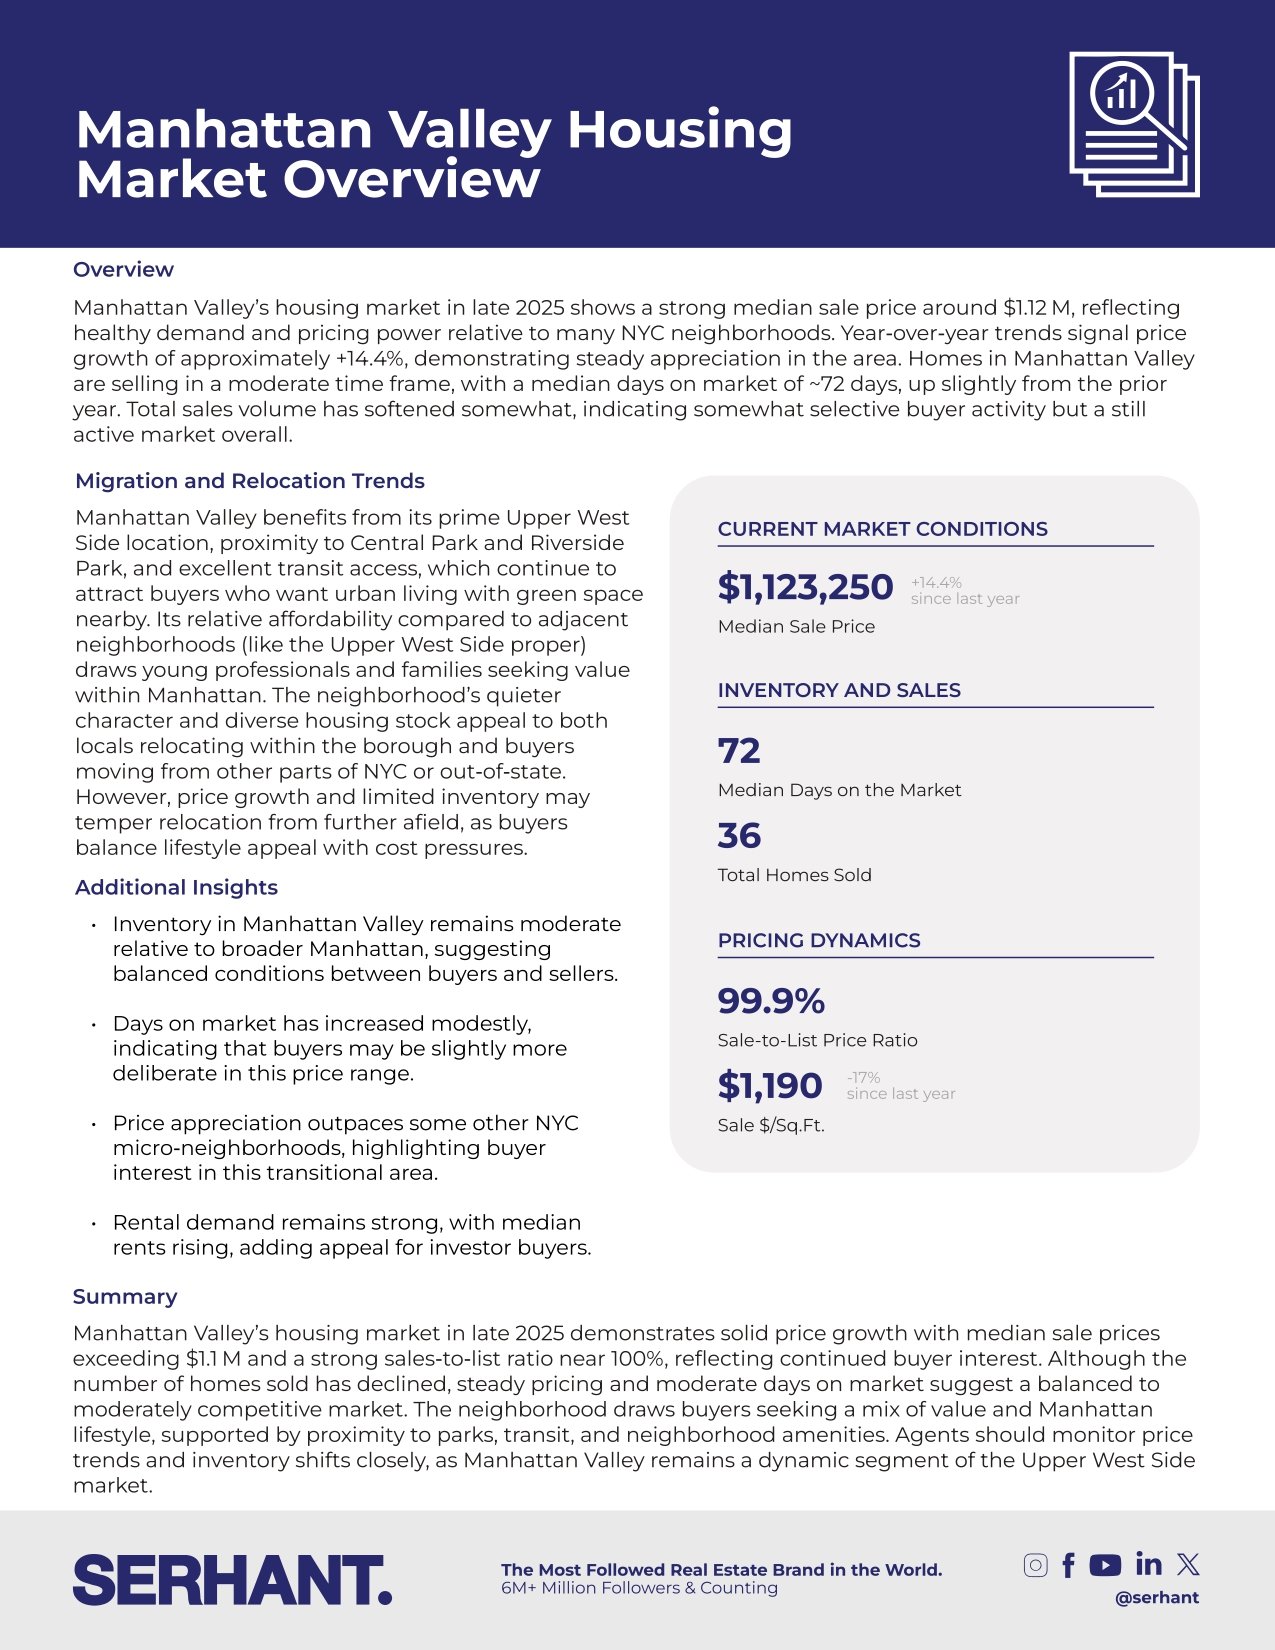
Manhattan Valley housing market infographic with late-2025 sales, pricing, inventory, and neighborhood trend data.

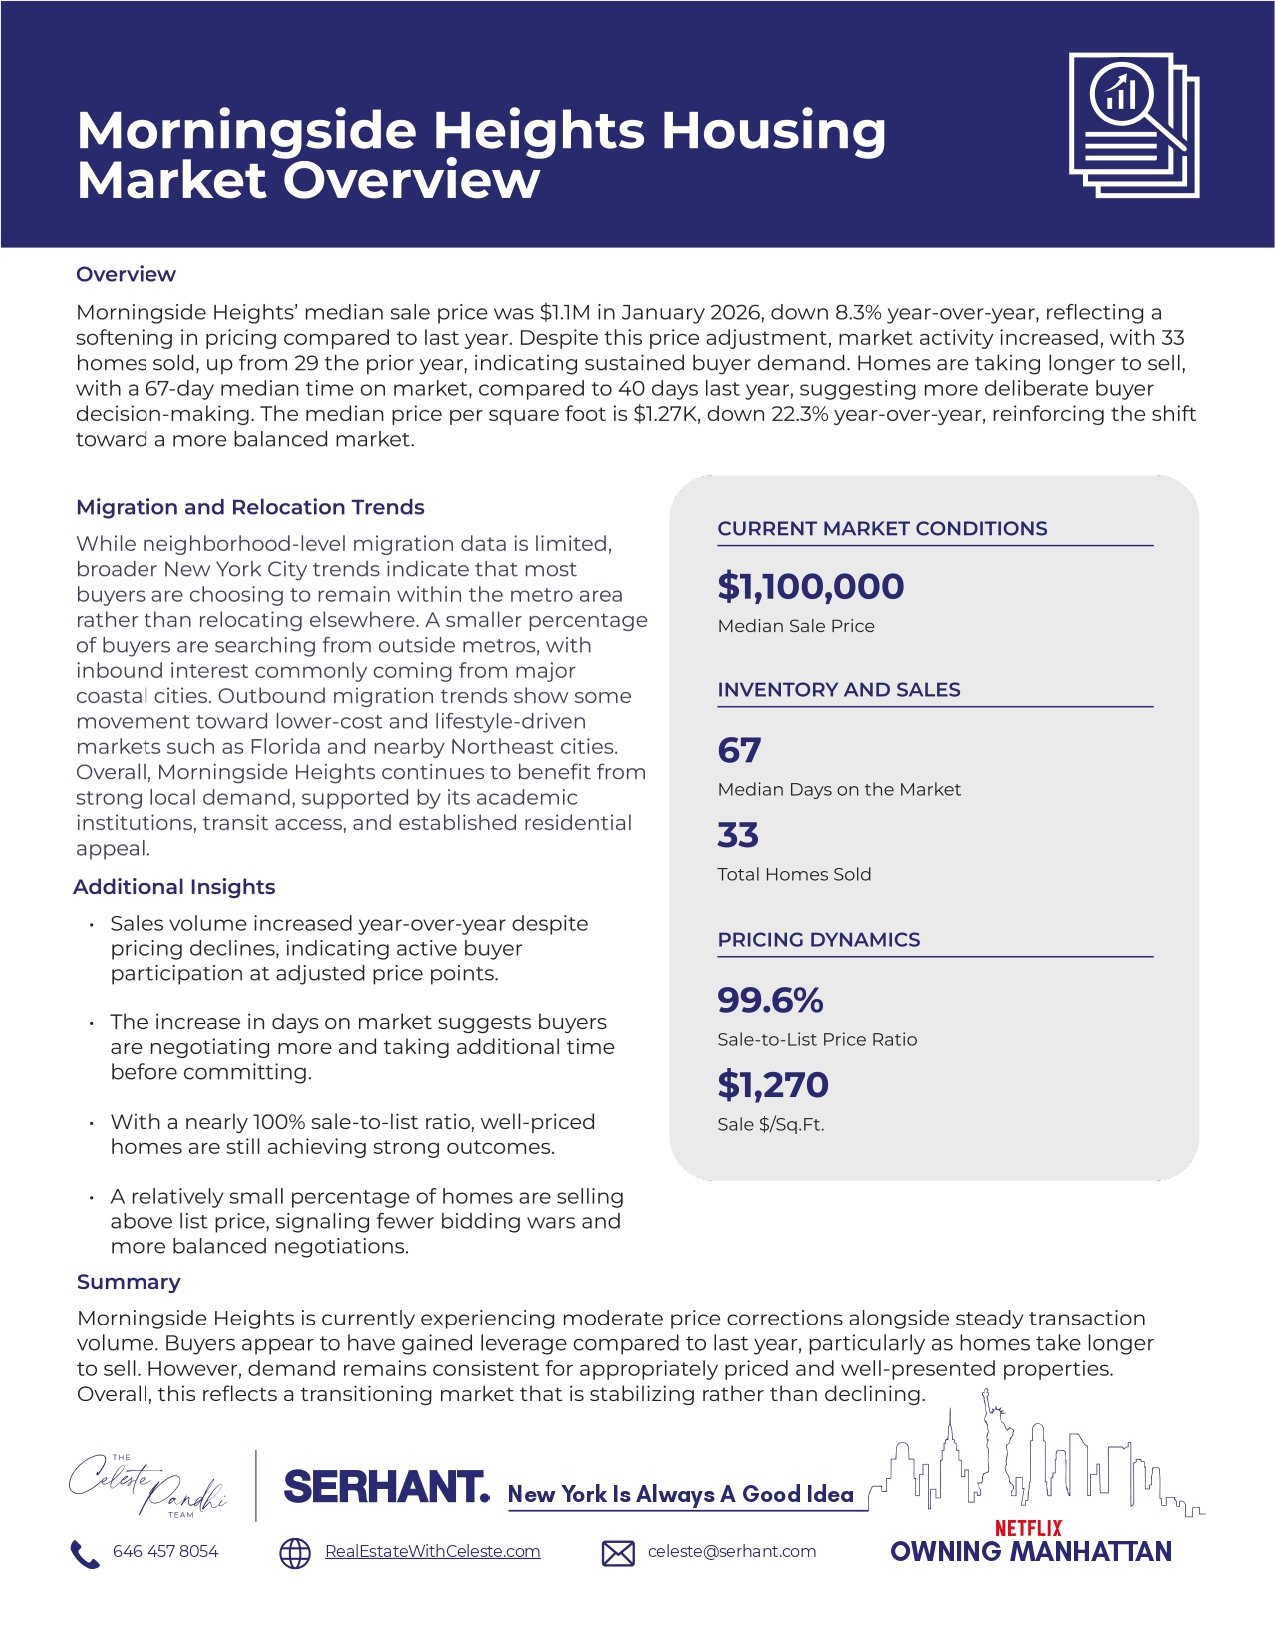
Morningside Heights housing market infographic with January 2026 prices, sales, market trends, and key statistics.

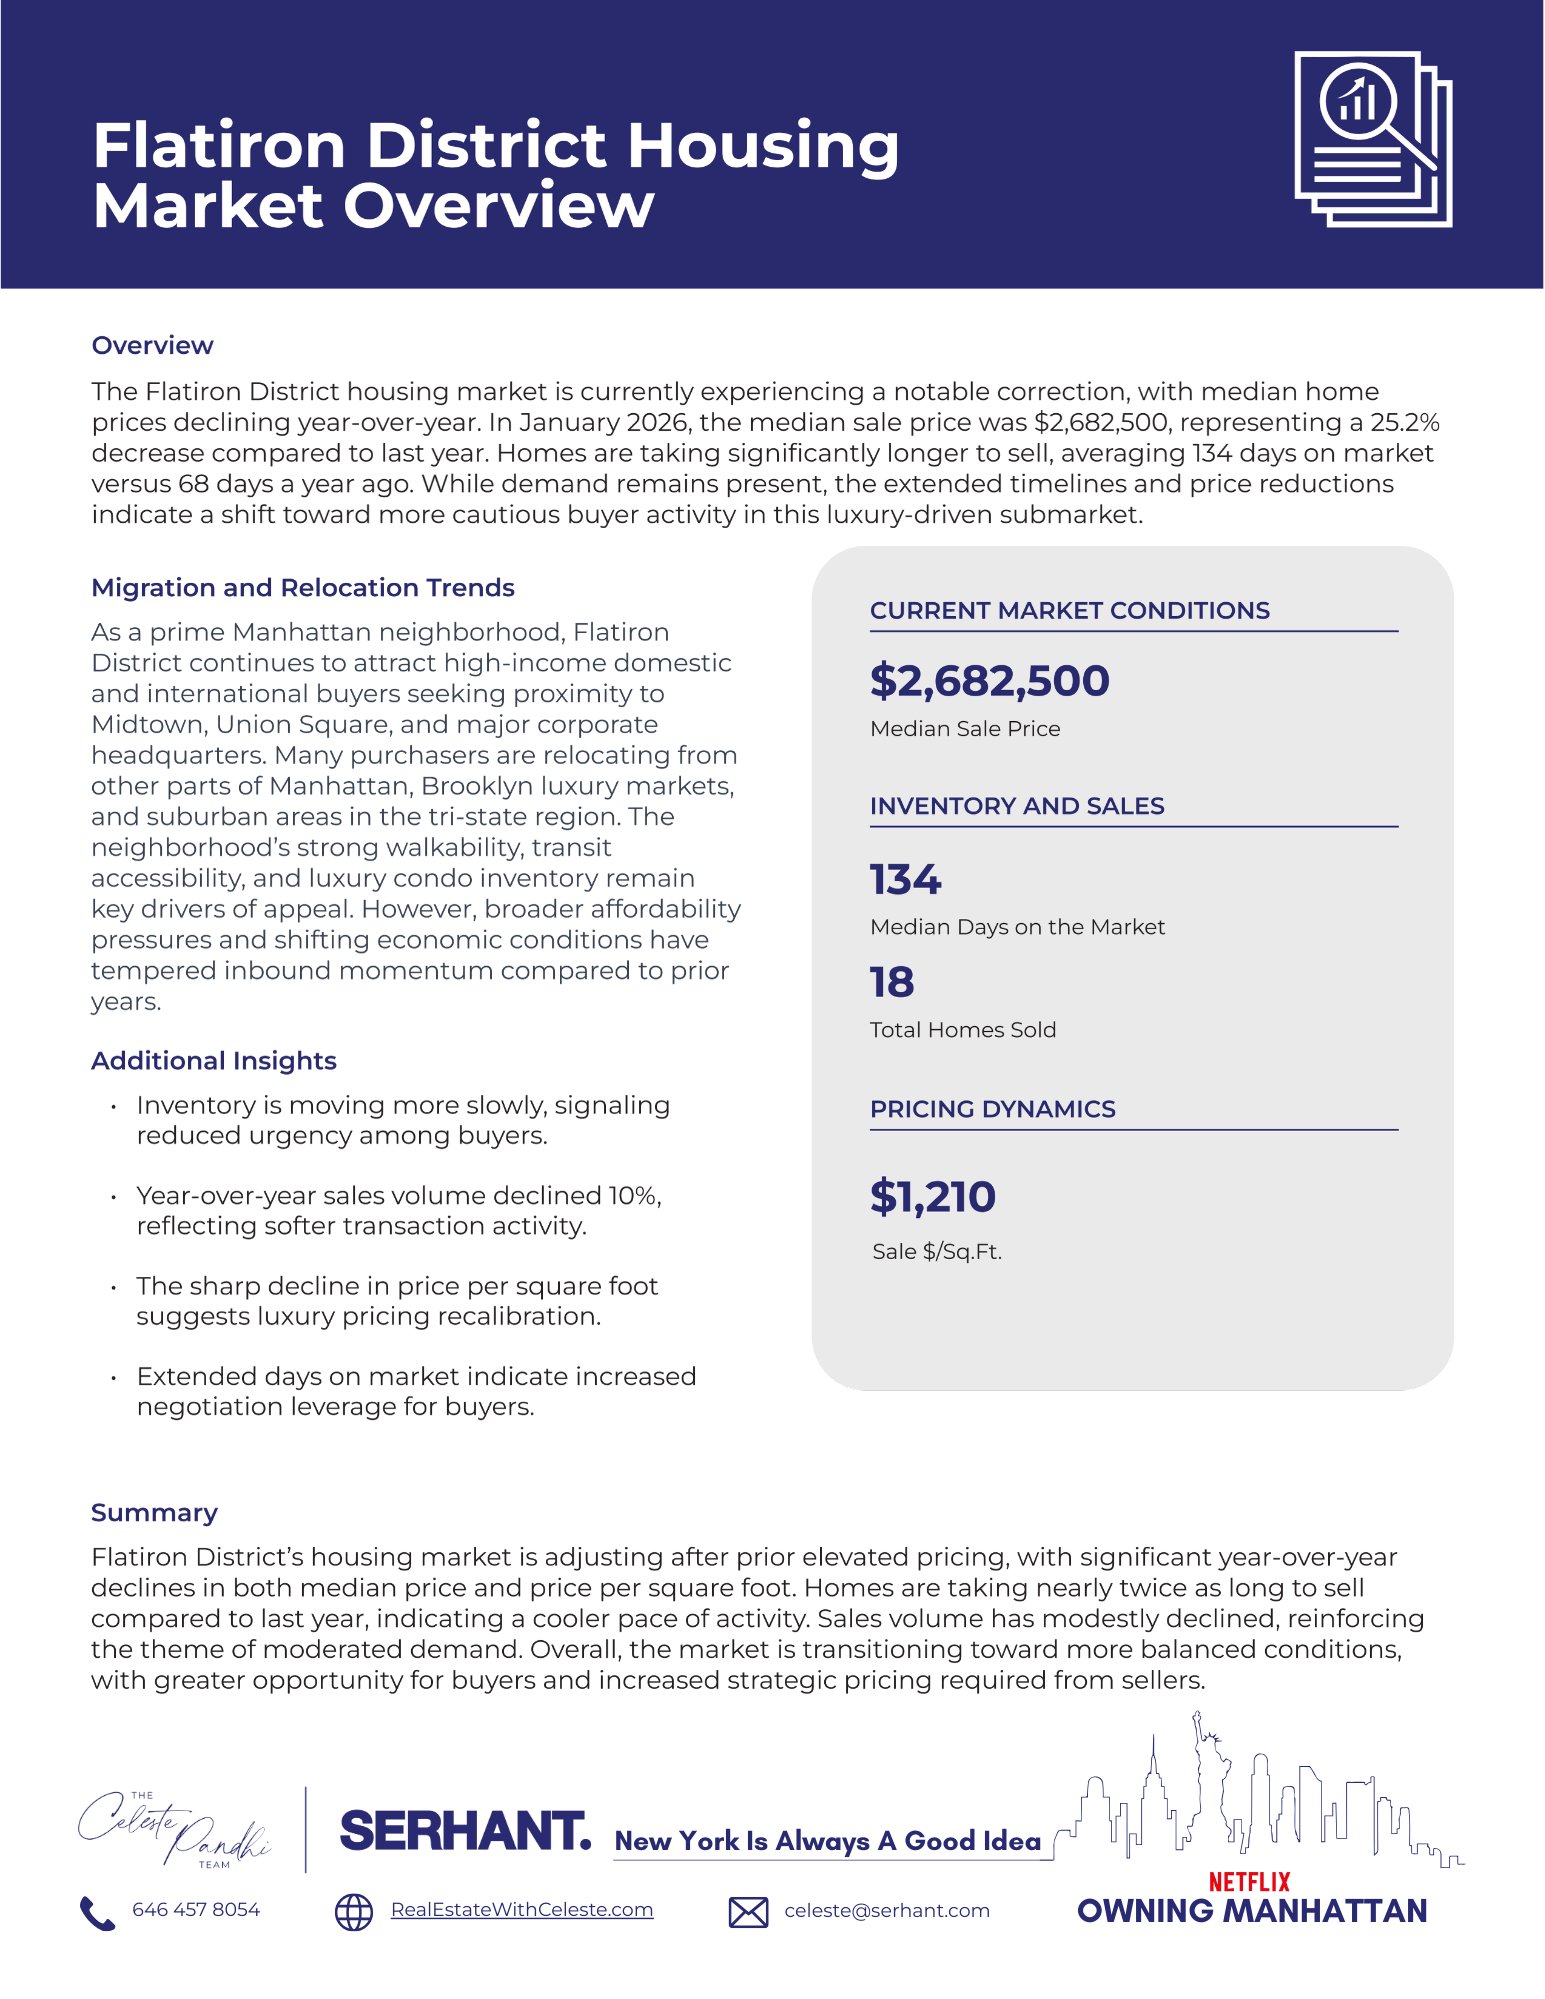
Flatiron District housing market overview with January 2026 pricing, sales, and days-on-market statistics.

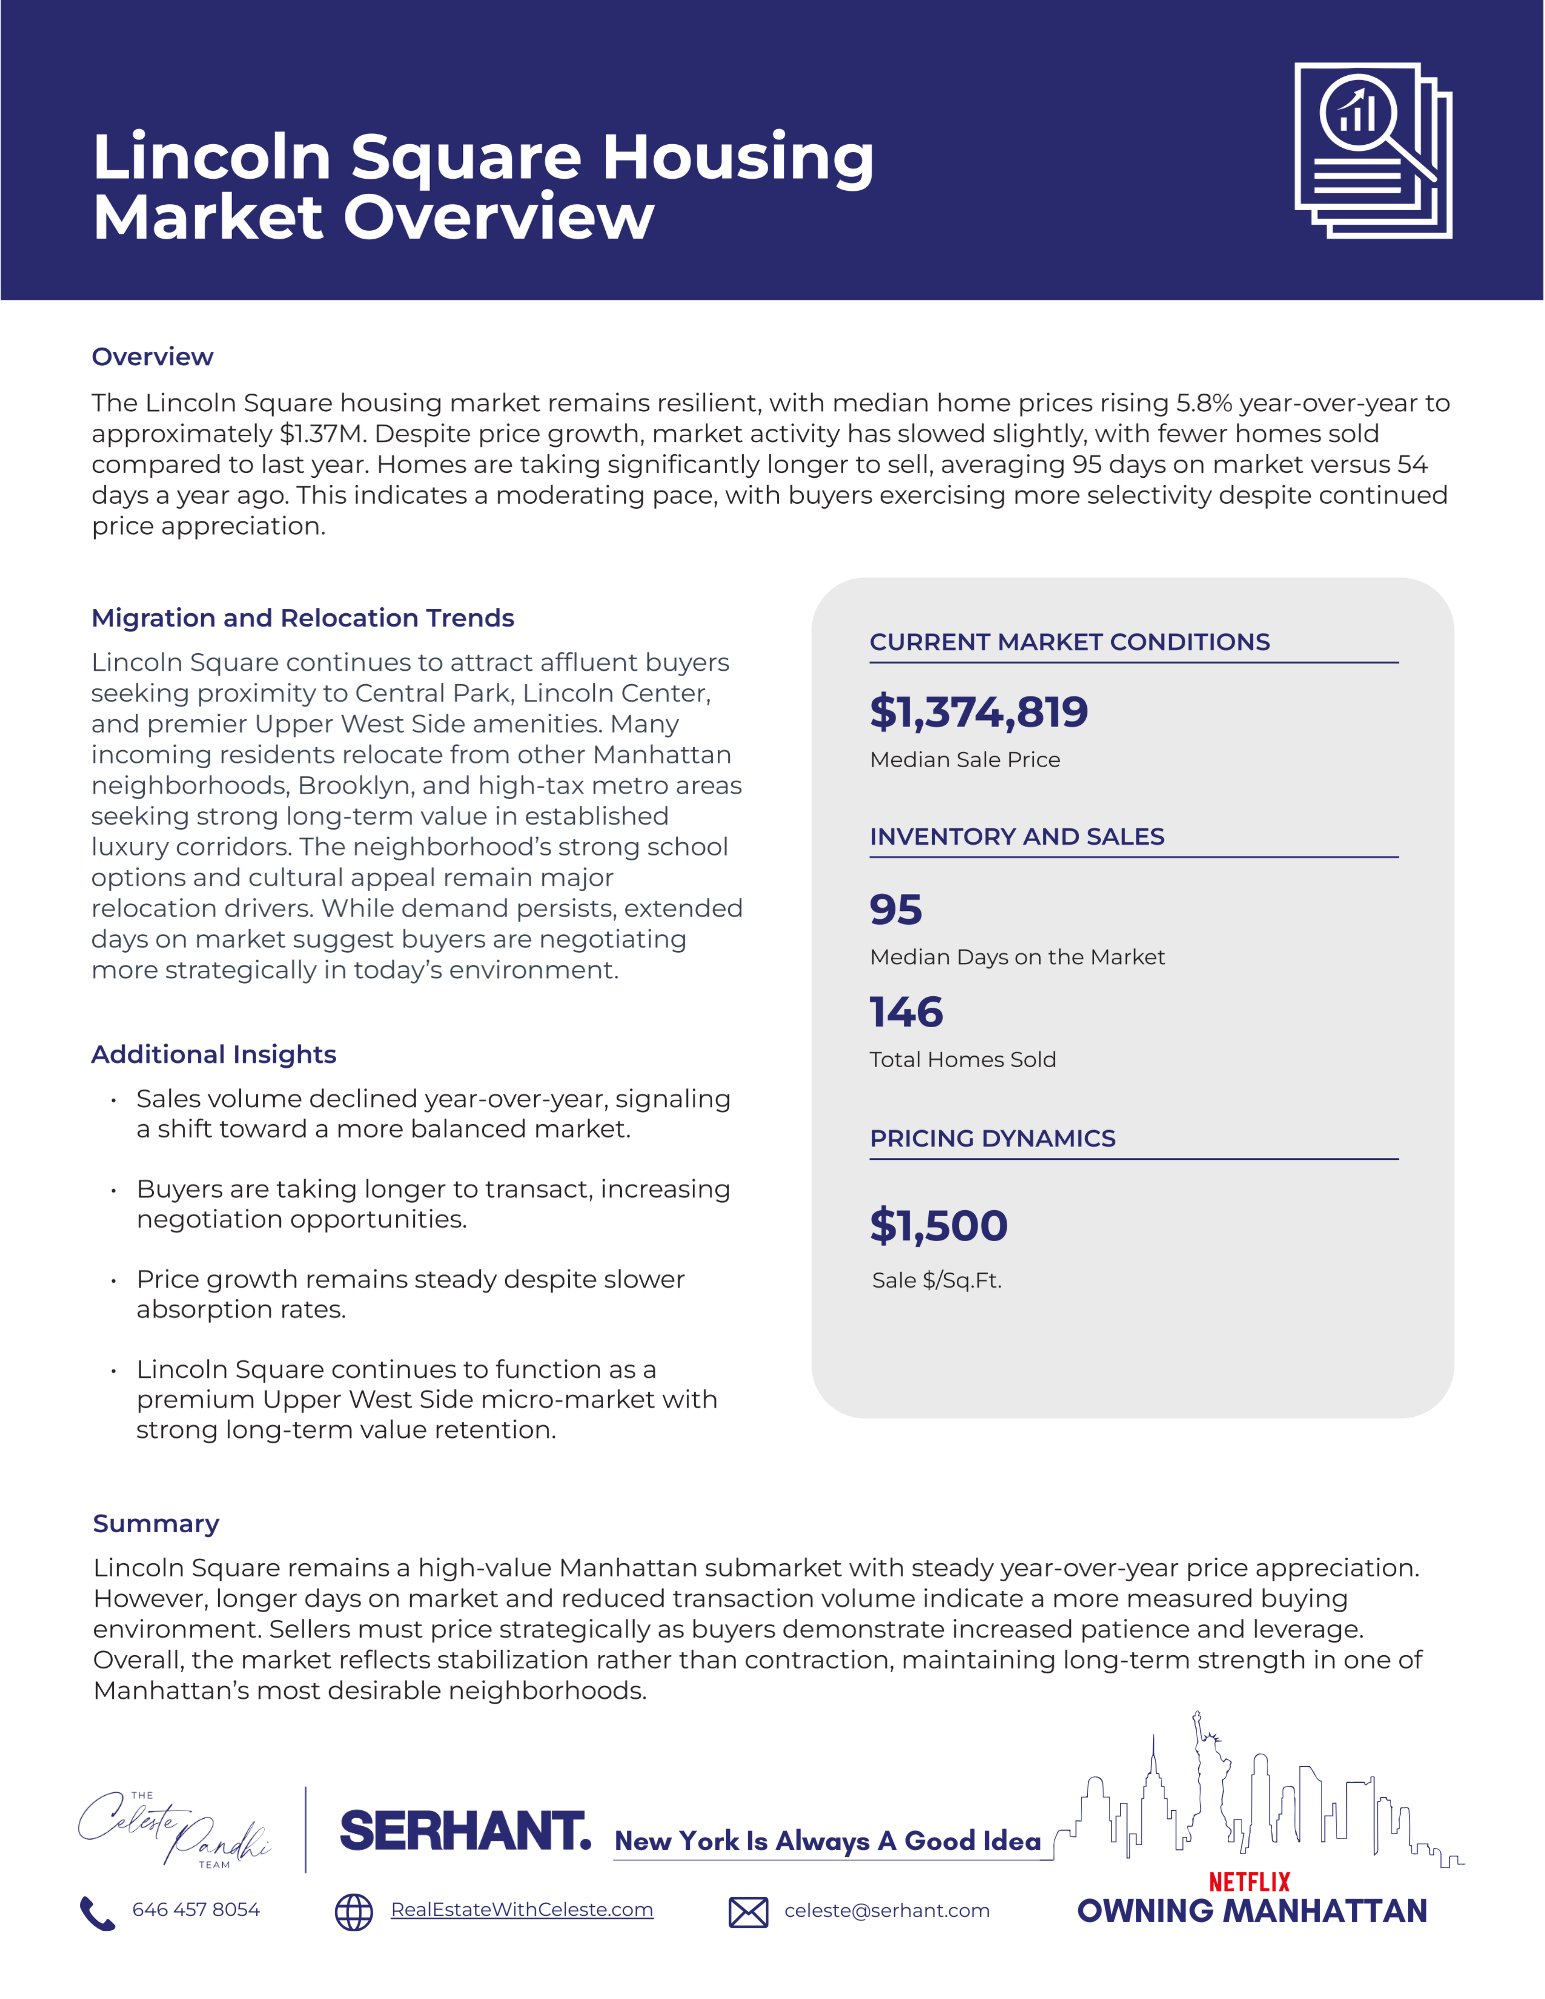
Lincoln Square housing market infographic with prices, sales figures, relocation trends, and market insights.

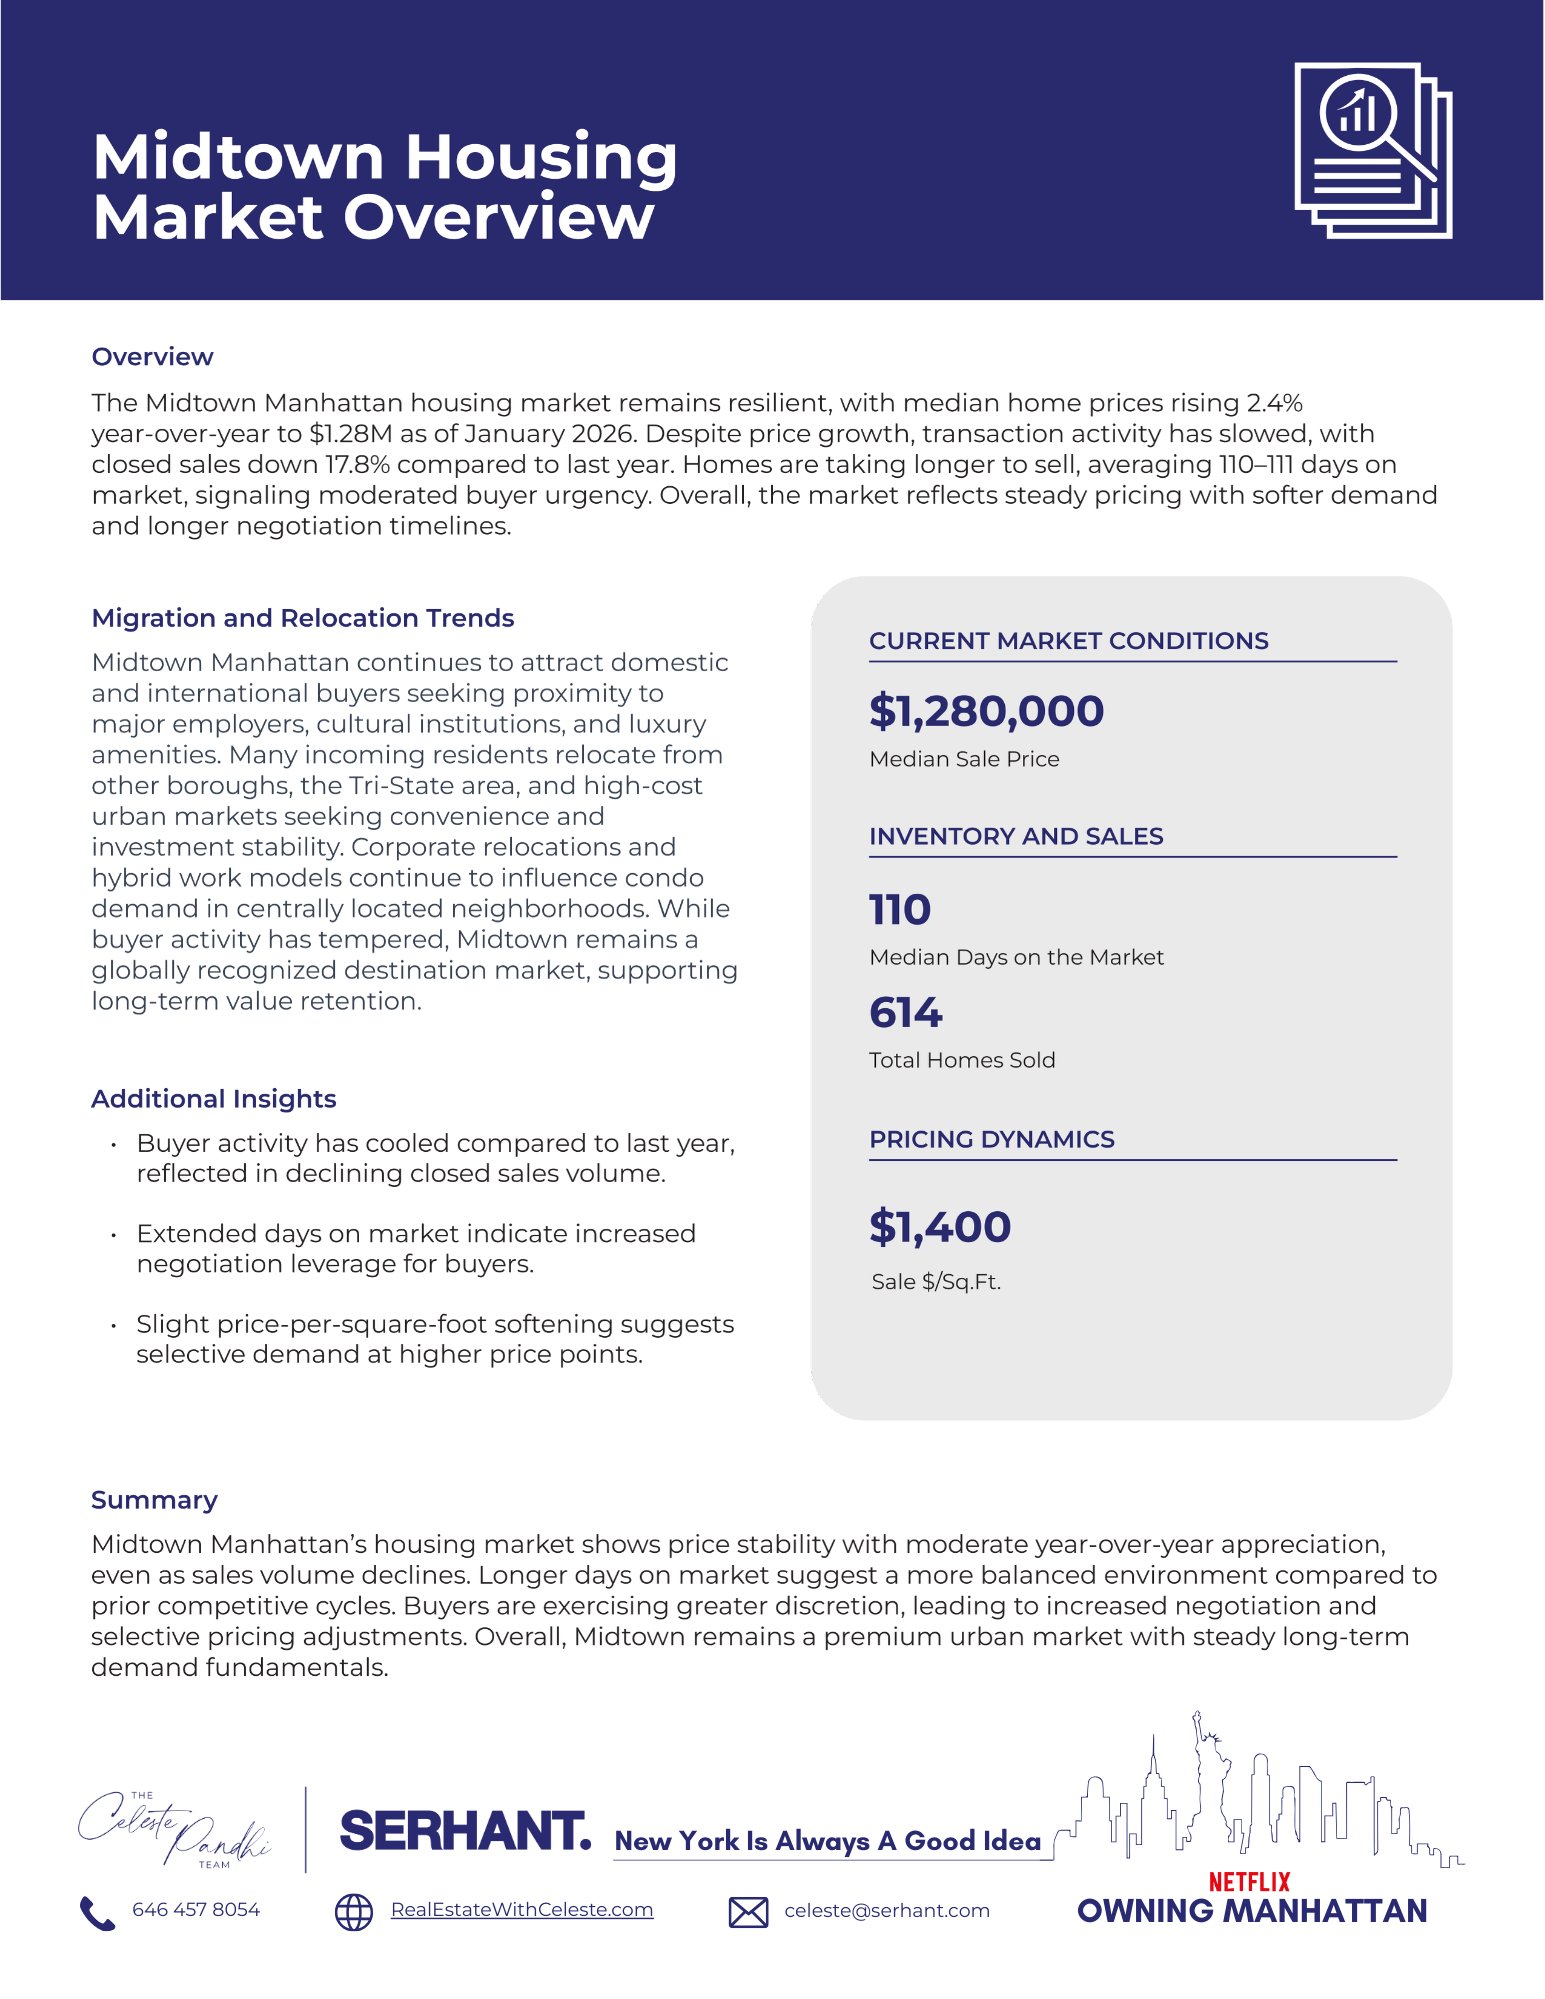
Midtown Manhattan housing market overview with January 2026 prices, sales, market trends, and real estate team contact details.

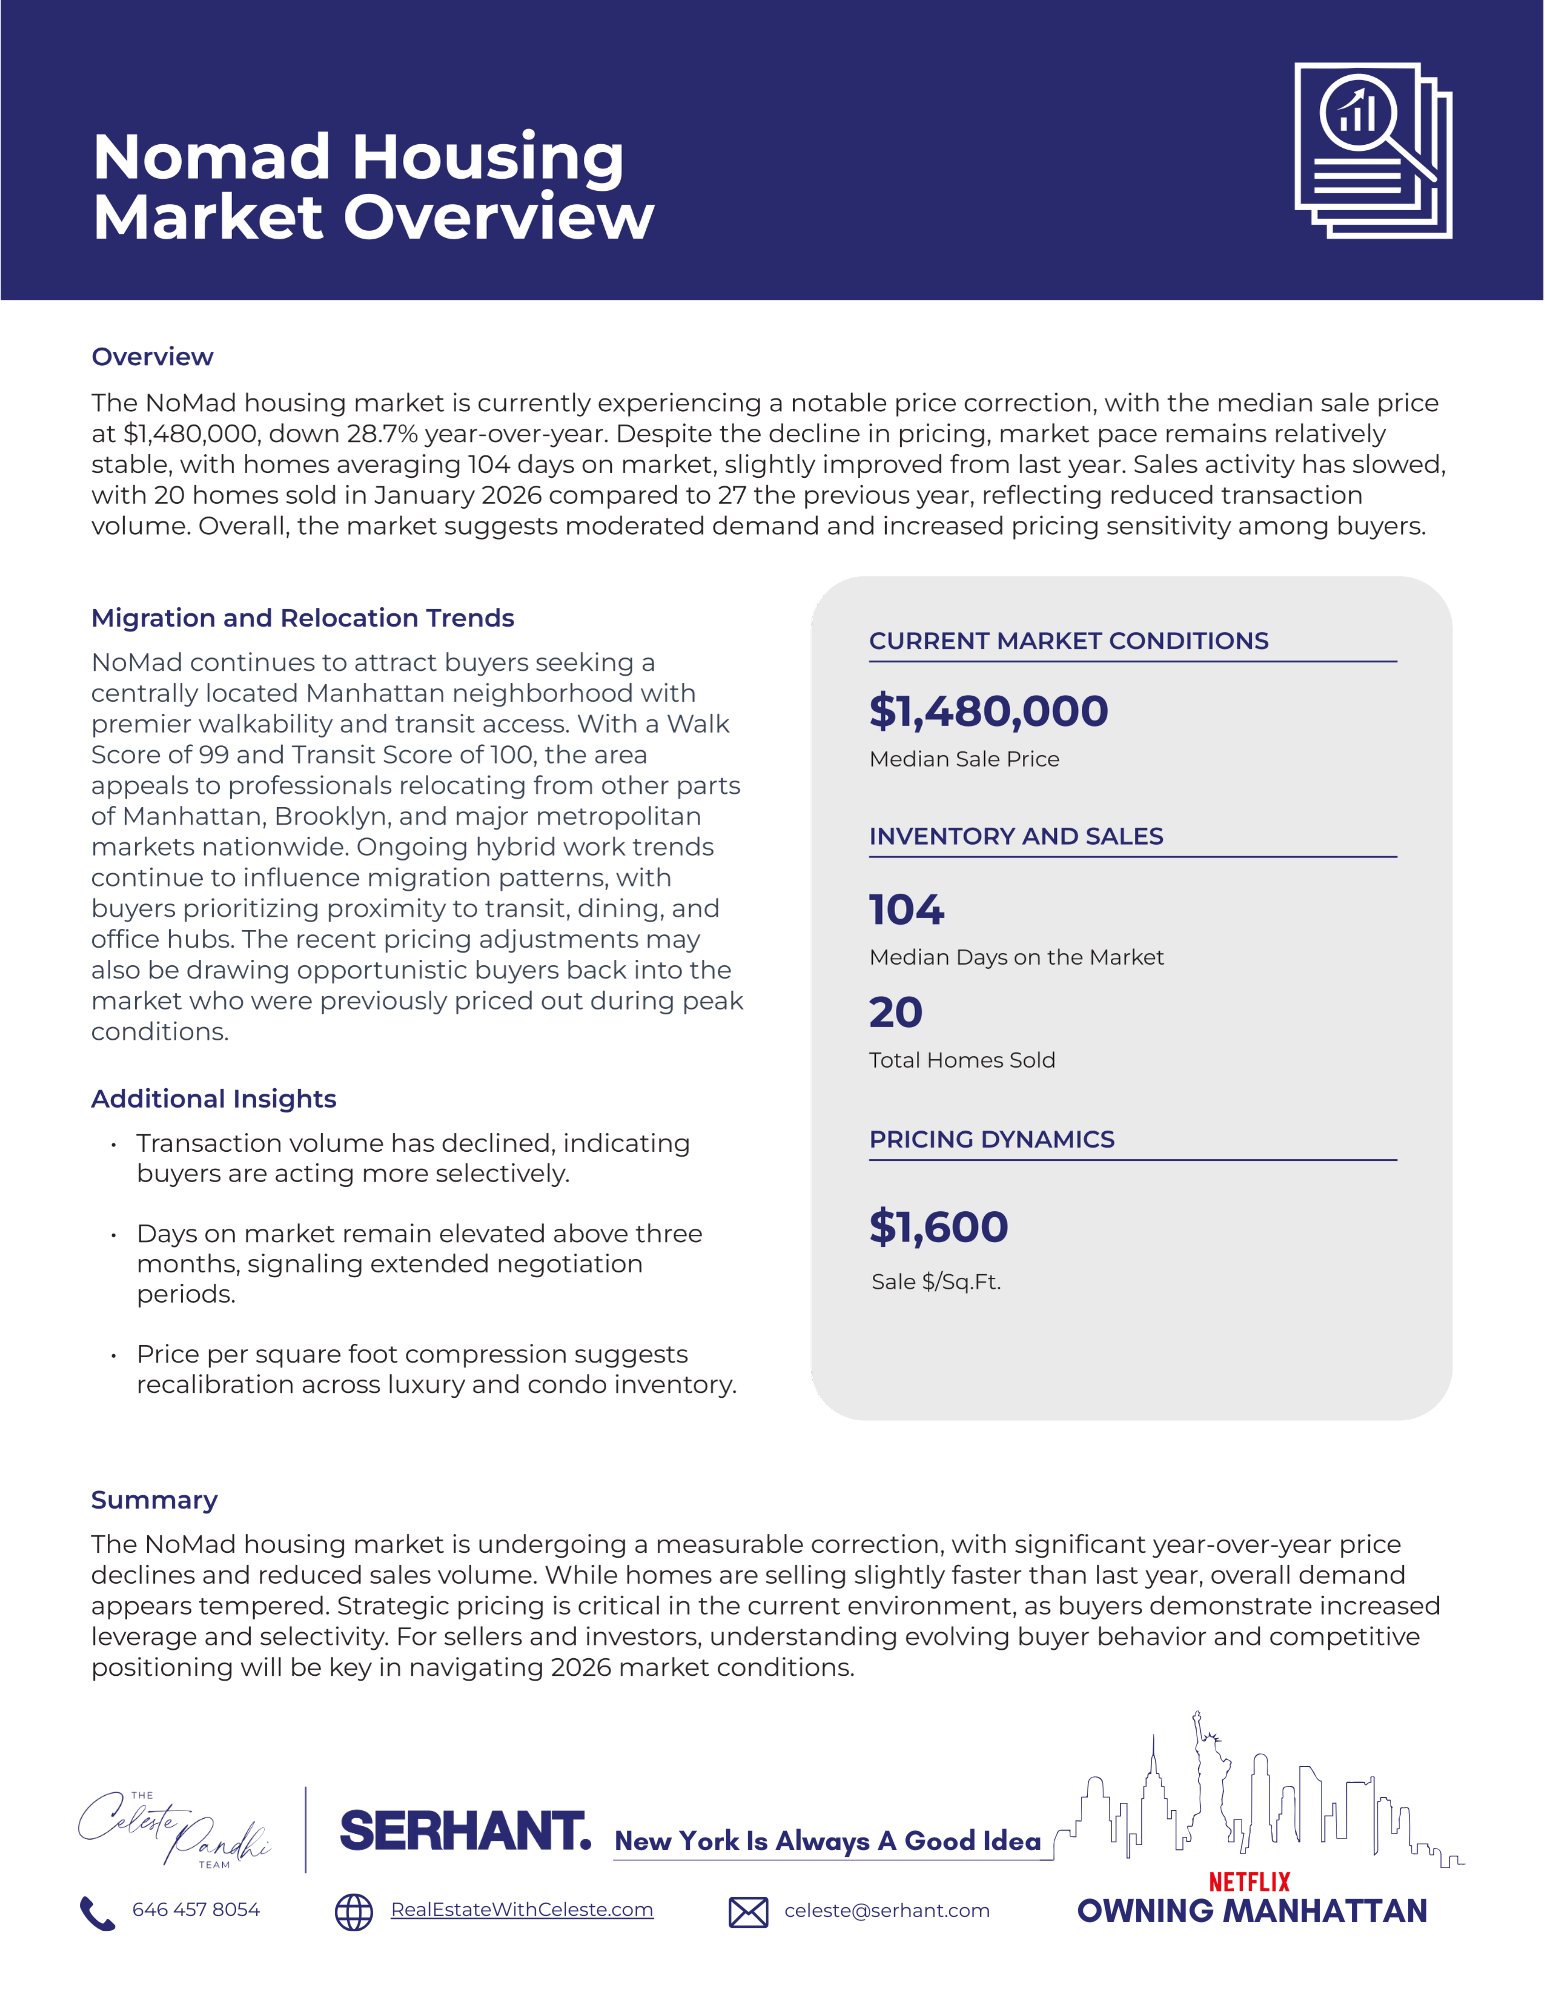
NoMad housing market overview with price, inventory, sales, and market trend statistics.

The Hamptons

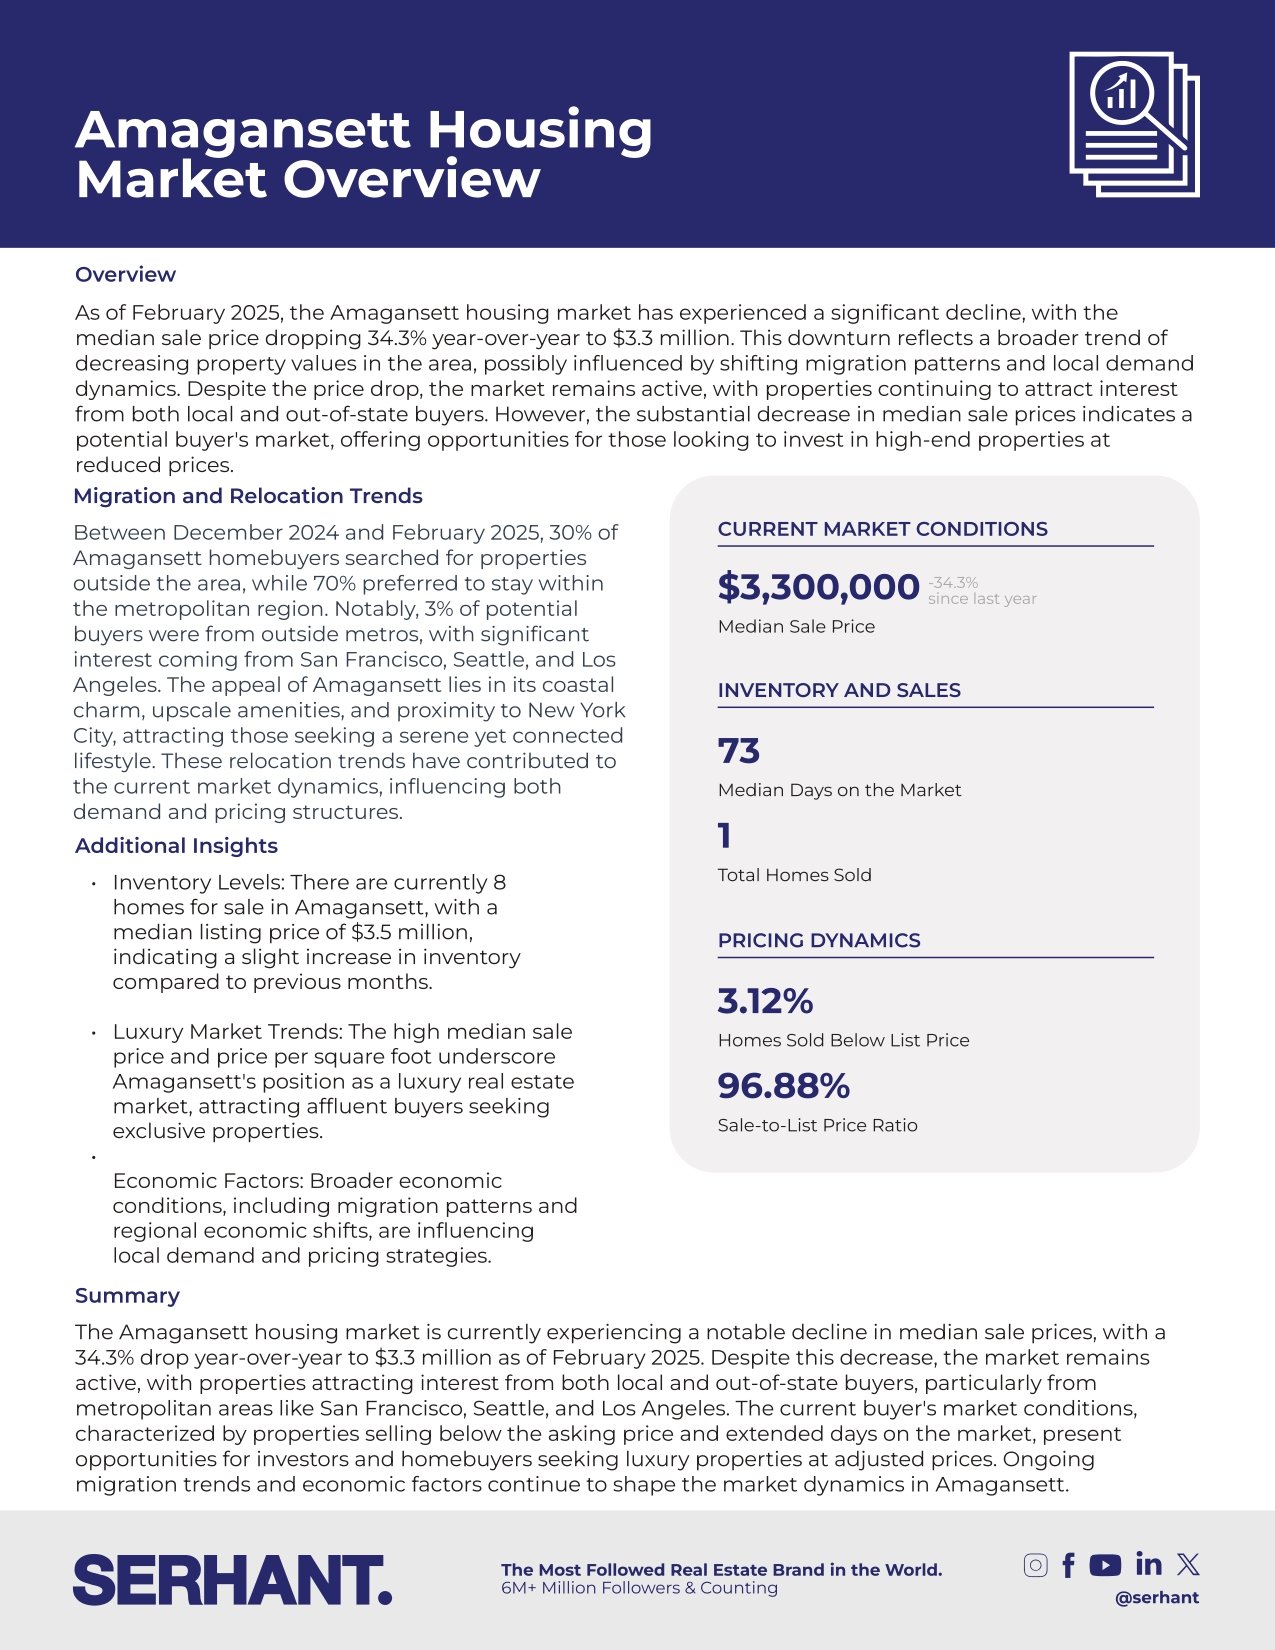
Amagansett housing market infographic with February 2025 price, sales, inventory, and migration statistics.

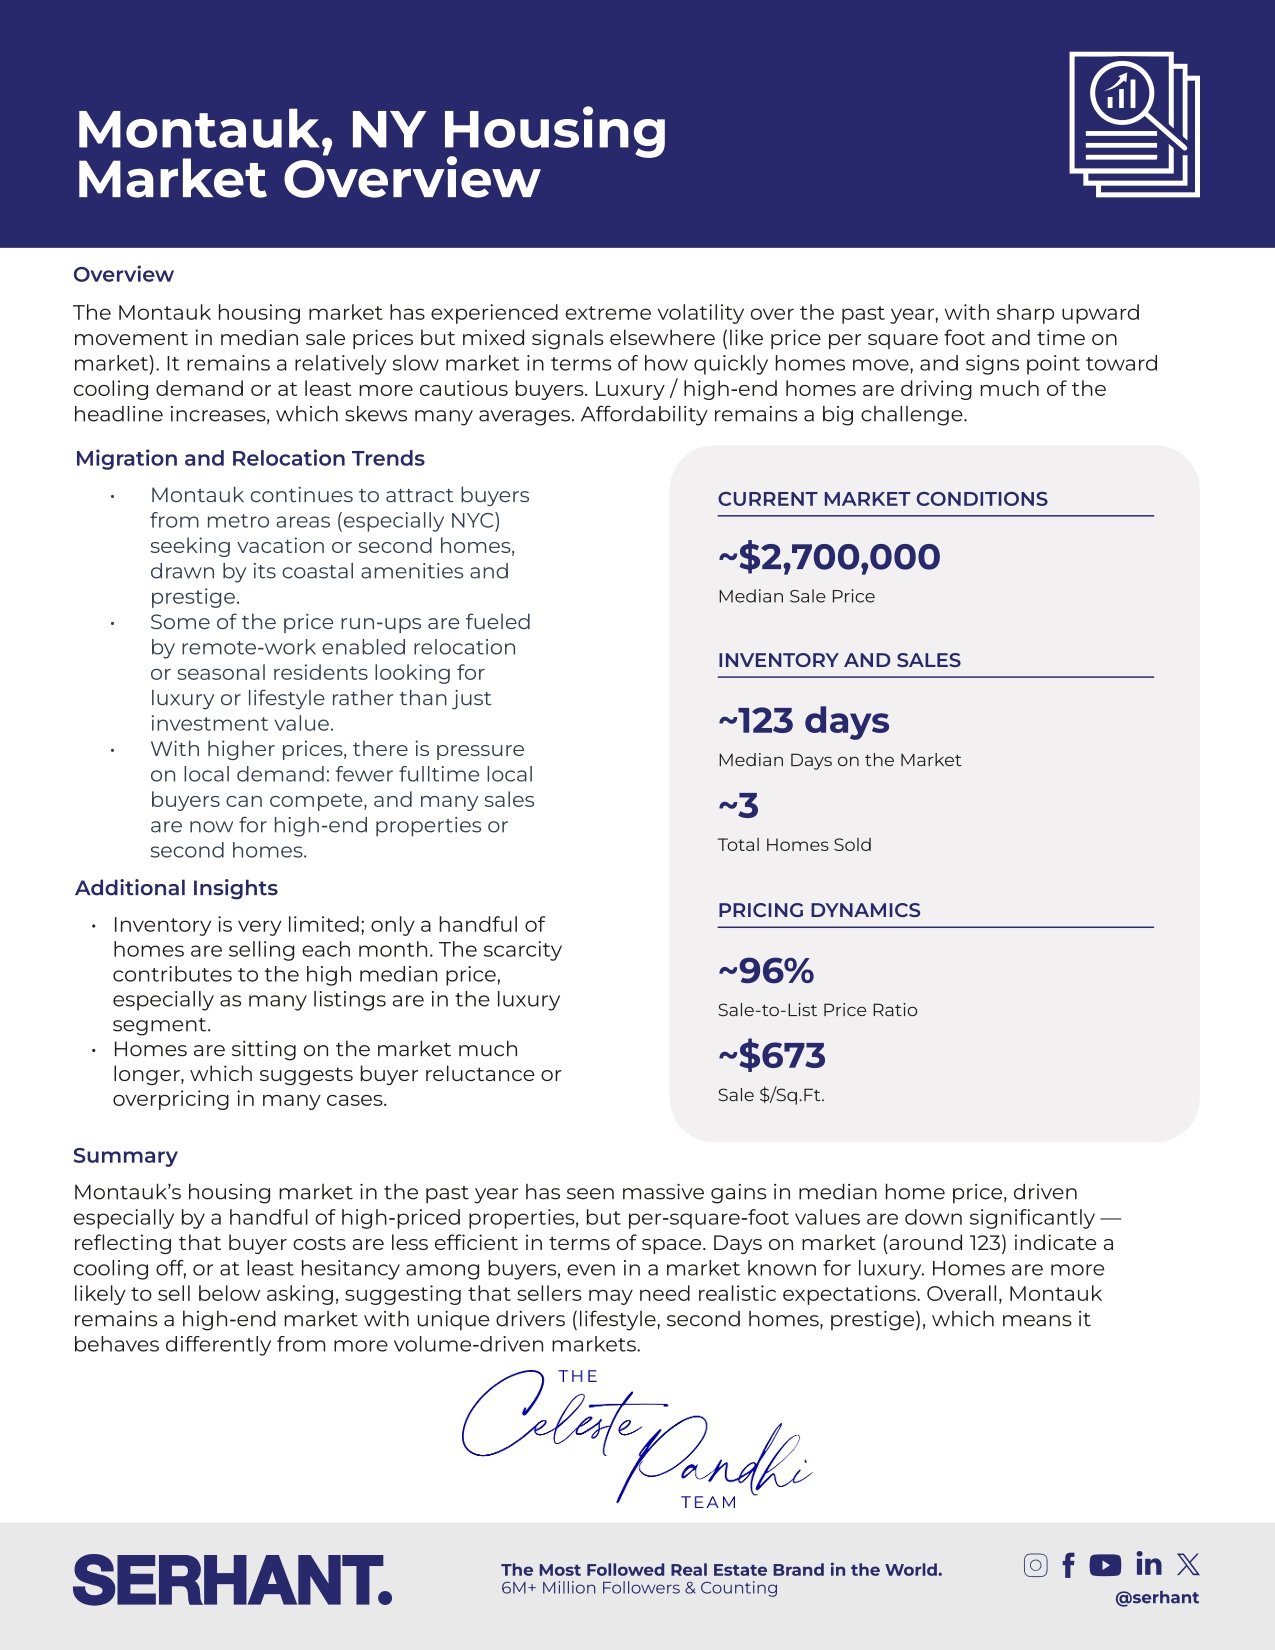
Montauk housing market overview with sales, pricing, and inventory statistics.

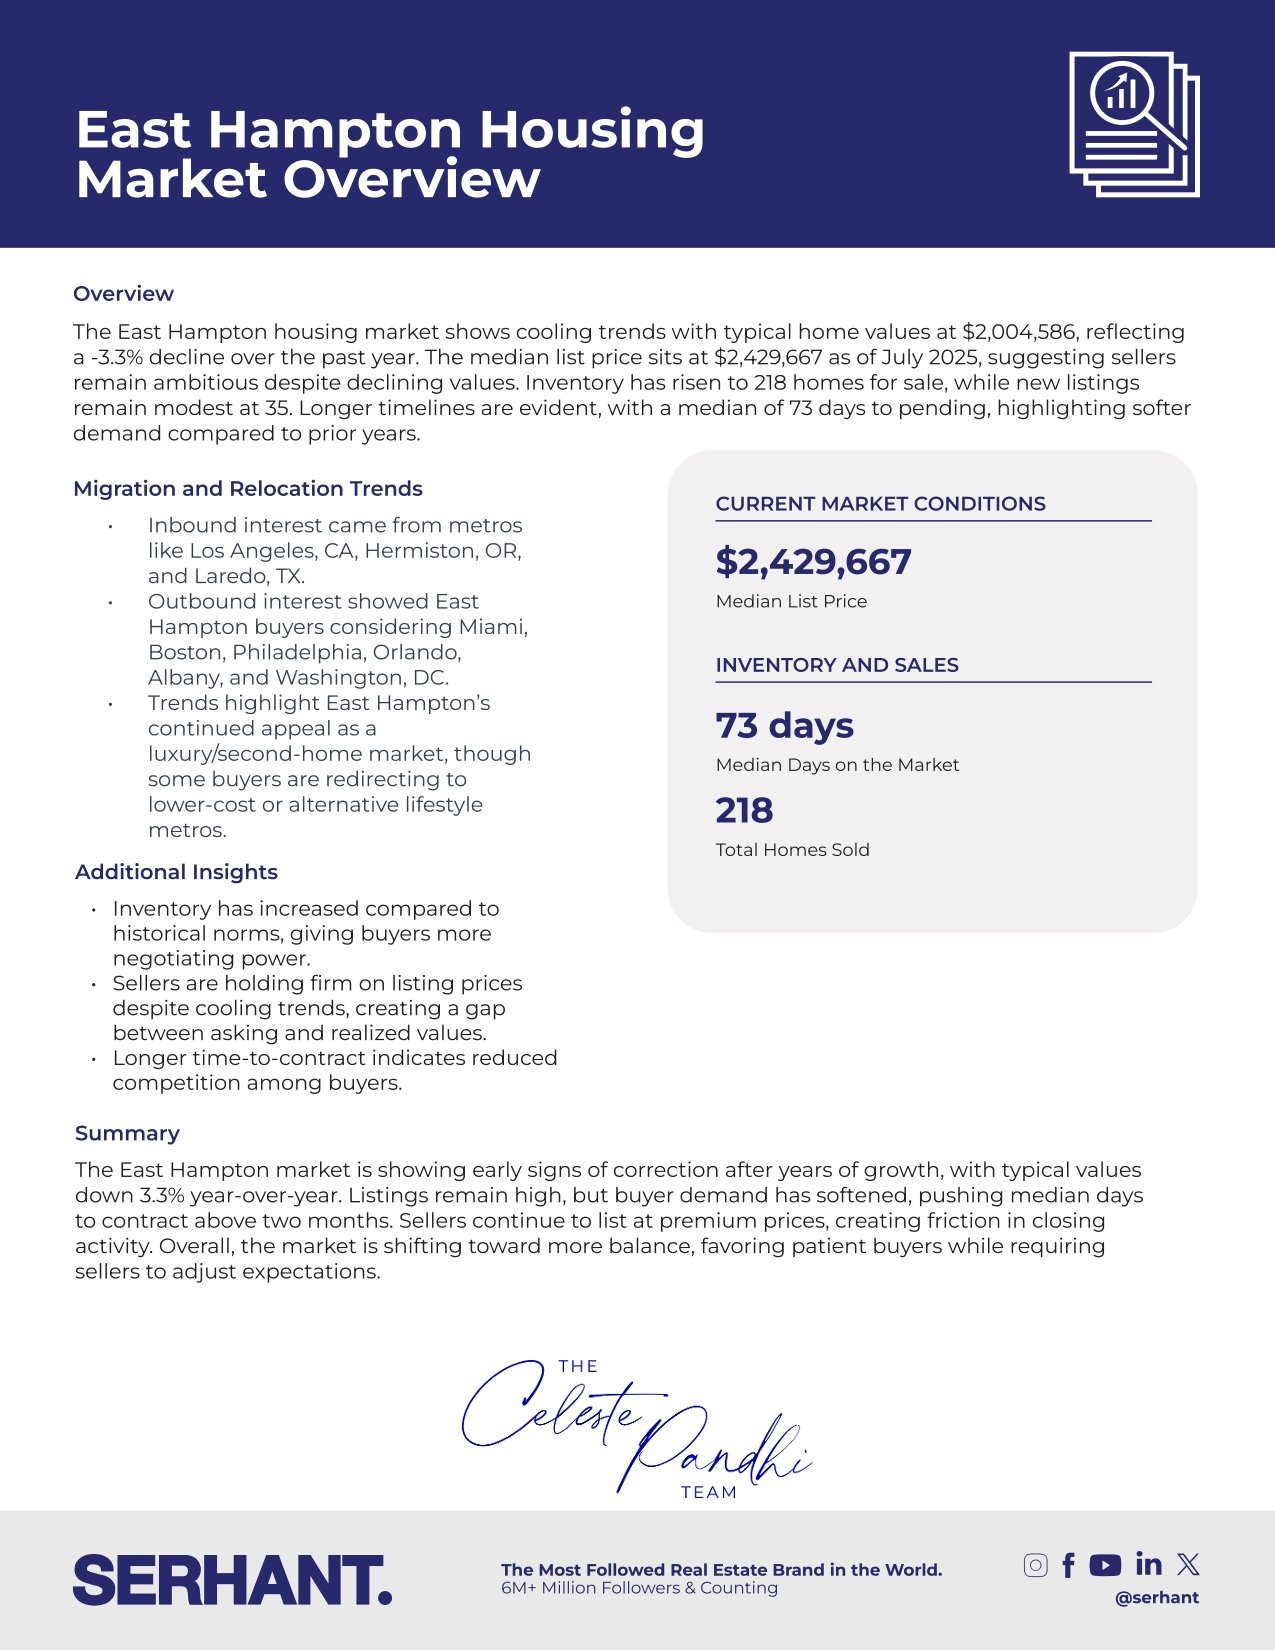
East Hampton housing market infographic with pricing, inventory, migration, and sales trends.

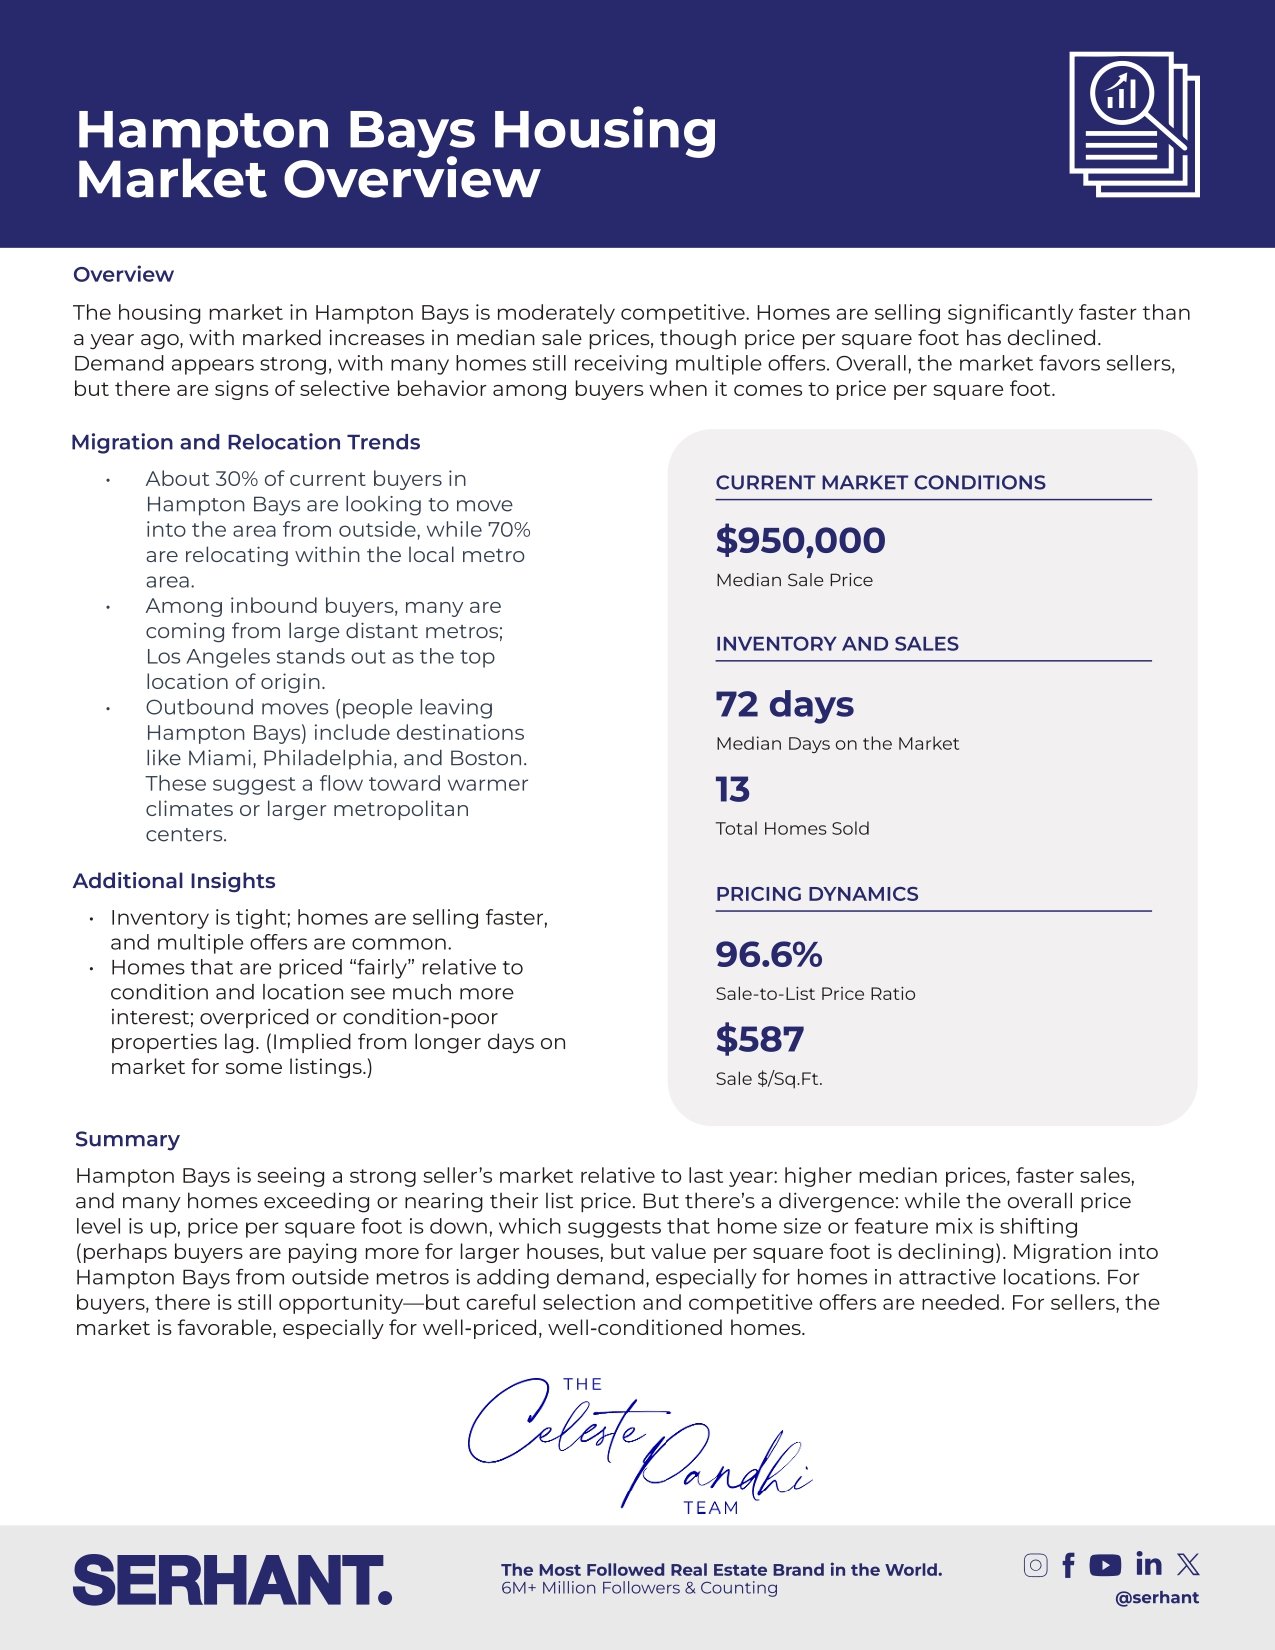
Hampton Bays housing market infographic with statistics, migration trends, and Celeste Pandhi Team branding.

Featured Articles

5 reasons fall is a great time to buy a home in NYC

StreetEasy  |  October 12, 2026

If you’re waiting until spring to splurge on your own little piece of the Big Apple pie, think twice. We spoke with real estate pros who all told us fall is a great ti… Read more

Homes.com
Ryan Serhant expands brokerage to Chicago with 40-agent team

Homes.com  |  October 6, 2026

New team boasts $600 million in sales within the last 12 months, according to the brokerage Read more

Fox Business
The game has been 'rigged’: Real estate star warns buyers face a housing 'obstacle course'

Fox Business  |  September 24, 2026

SERHANT. founder and CEO Ryan Serhant speaks to Fox News Digital at his SoHo headquarters, discussing how local policy friction, property tax burdens and insurance spi… Read more

Inman
SERHANT. unveils S.MPLE 2.0, an AI that tells agents what to do next

Inman  |  September 22, 2026

Ryan Serhant announced S.MPLE 2.0 on stage at Blueprint Wednesday Read more

Forbes
Private Listings Solve The Wrong Pricing Problem

Forbes  |  September 22, 2026

Sellers generally ask two things when they put a home on the market: “How much will I get and how long will it take?” Read more

Forbes
NYC Real Estate Is Quiet. Prices Aren’t

Forbes  |  August 26, 2026

The current New York real estate market looks odd according to the old playbook. Read more

The Real Deal Real Estate News
Inside rising townhouse prices across New York City

The Real Deal  |  August 19, 2026

Breaking down banner home sales, tracking rent increases & more in notes from a resi reporter Read more

Brick building corner with arched windows and ornate cornice beneath a dramatic cloudy sky.
Good Bones, Better Math: The Prewar Co-Op's Quiet Comeback

Forbes  |  August 14, 2026

Despite their reputation as outdated, prewar co-ops are proving to be resilient, desirable, and financially sound investments. The market shift suggests that condos ma… Read more

Work with us

We pride ourselves on informing and educating our clients in order to make better real estate decisions. Contact us today!

Follow Us